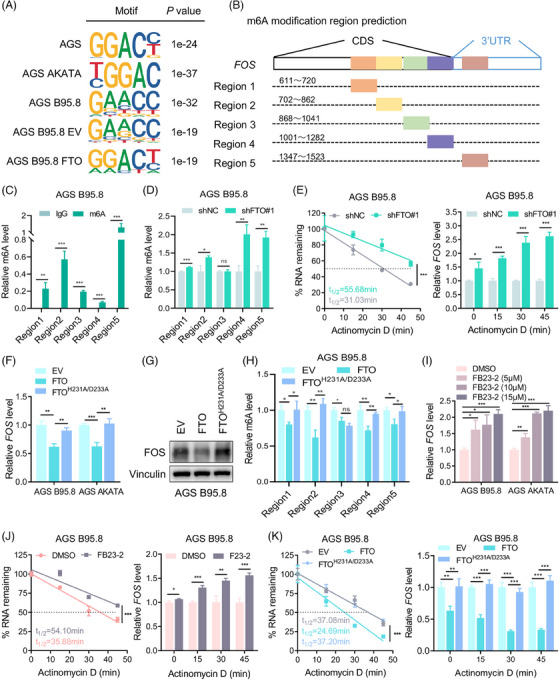
FIGURE 5.

FOS is regulated by FTO‐dependent m6A demethylation. (A) MeRIP‐seq analysis showing canonical RRACH m6A motifs of FOS transcripts in EBVaGC cells and EBVnGC cells. (B) The predicted m6A regions in FOS mRNA. (C) MeRIP‐qPCR analysis of m6A enrichment in regions 1−5 of FOS transcripts in AGS B95.8 cells. (D) MeRIP‐qPCR analysis of m6A enrichment in regions 1−5 of FOS mRNA in FTO‐knockdown and control AGS B95.8 cells. (E) The decay rate (left) and qPCR detection (right) of FOS mRNA at the indicated time point after actinomycin D (ActD) treatment in FTO‐knockdown versus control groups. (F and G) RT‐qPCR analysis (left) and immunoblotting (right) of FOS expression in EBVaGC cells with empty vector (EV), wild‐type FTO overexpression (FTO) and H231A/D233A‐mutant FTO overexpression (FTOH231A/D233A). (H) MeRIP‐qPCR analysis was conducted to detect the relative m6A level of FOS mRNA regions in AGS B95.8 cells transfected with vectors expressing wild‐type or catalytic‐mutant FTO. (I) Relative FOS mRNA expression in EBVaGC cells treated with DMSO, FB23‐2 (5 µM), FB23‐2 (10 µM) and FB23‐2 (15 µM). (J) The decay rate (left) and qPCR assay (right) of FOS mRNA at the indicated times after ActD treatment in FB23‐2 (15 µM) versus DMSO‐treated AGS B95.8 cells. (K) The decay rate of FOS transcripts in AGS B95.8 cells transfected with EV, FTO and FTOH231A/D233A plasmids was analysed by nonlinear regression (left), and the relative FOS mRNA expression of different groups was detected by qPCR analysis at each time point (right). The data in (C–F and H–K) are presented as the means ± SDs. p‐Values were determined by Student's t test (C, D, F, H, I and relative FOS level in E, J and K) and two‐way ANOVA (%RNA remaining in E, J and K). *p < 0.05; **p < 0.01; ***p < 0.001. IgG was used as the negative control and the relative m6A level was normalized by the input in (C, D and H). Vinculin was included as a loading control.
