
FIGURE 6.
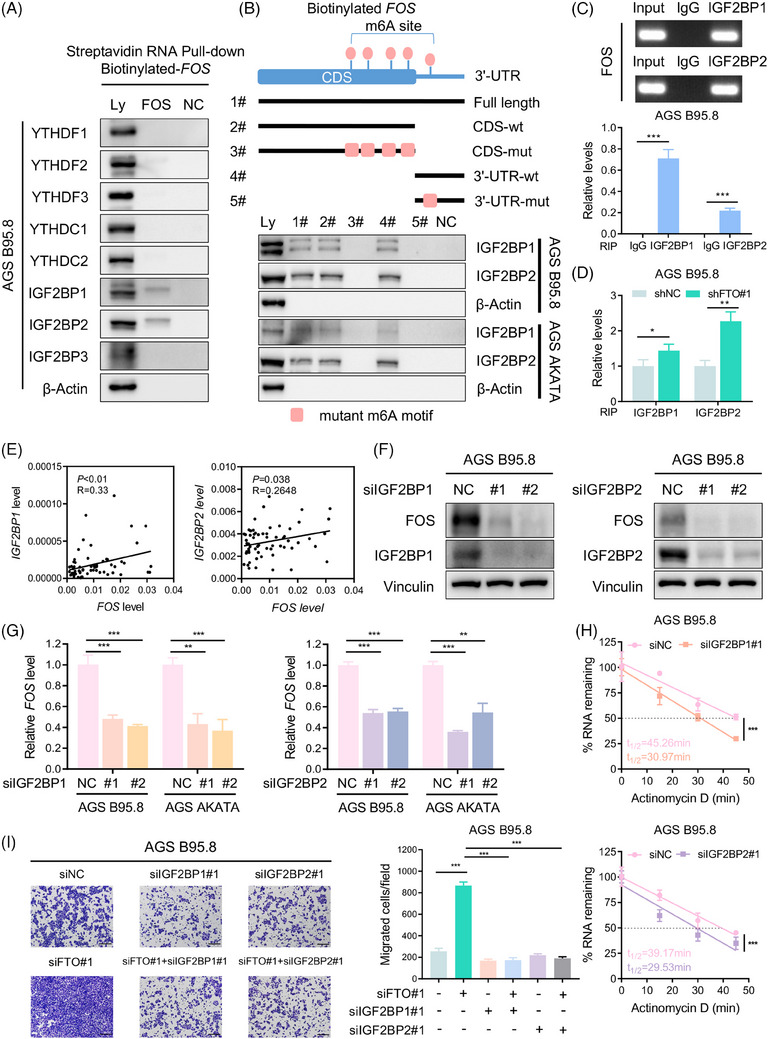
IGF2BP1/2 promotes FOS transcript stability by binding its m6A‐modified mRNA. (A) Western blotting of the YTH family and IGF2BP family with cell lysate (Ly), biotinylated full‐length FOS (FOS) and beads only (NC) in AGS B95.8 cells using an RNA pulldown assay. (B) Western blotting assay of IGF2BP1/2 with cell lysate (Ly), full‐length FOS (#1), the FOS CDS region with or without m6A motif mutation (#2, #3), the FOS 3′‐UTR with or without m6A motif mutation (#4, #5) and beads only (NC) in EBVaGC cells. (C) Agarose gel electrophoresis (top) and qPCR detection (bottom) of RIP assays indicated direct binding between IGF2BP1/2 protein and FOS transcripts in AGS B95.8 cells. (D) The enrichment of IGF2BP1/2 protein binding FOS mRNA in AGS B95.8 cells upon FTO silencing was determined by RIP assays. (E) Q‐PCR assay illustrating that FOS expression was positively correlated with IGF2BP1 (left) and IGF2BP2 (right) expression in 62 EBVaGC specimens from the SYSUCC cohort. (F) Immunoblotting assay of FOS protein levels after IGF2BP1 (left) and IGF2BP2 (right) inhibition in AGS B95.8 cells. (G) RT‐qPCR analysis of FOS mRNA expression in EBVaGC cells with IGF2BP1 (left) and IGF2BP2 (right) inhibition. (H) The decay rate of FOS transcripts in AGS B95.8 cells after IGF2BP1 knockdown (top) and IGF2BP2 knockdown (bottom). (I) Representative images (left) and quantification (right) of migrated AGS B95.8 cells with siNC, siFTO#1, siIGF2BP1#1, siFTO#1 + siIGF2BP1, siIGF2BP2#1, siFTO#1 + siIGF2BP2#1. Scale bar: 200 µm. The data in (C, D and G–I) are presented as the means ± SDs. p‐Values were determined by Student's t test (C, D, G, I), two‐way ANOVA (H), Pearson's correlation analysis and chi‐square test (E). *p < 0.05; **p < 0.01; ***p < 0.001. β‐Actin (A and B) and Vinculin (F) were included as loading controls.