
FIGURE 7.
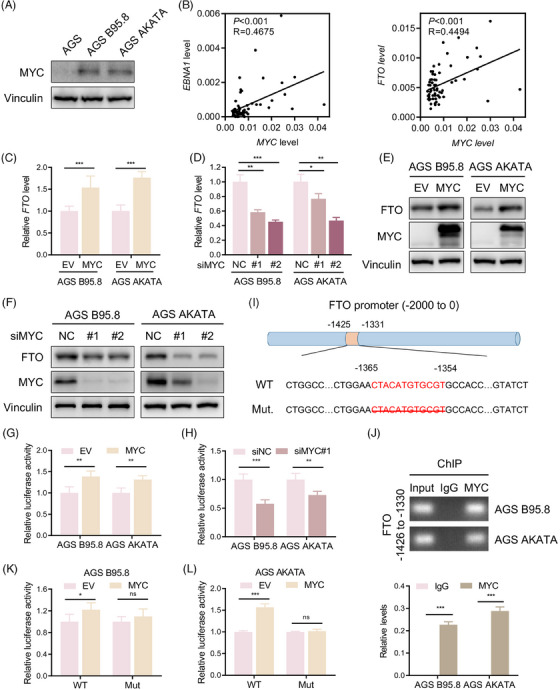
EBV induces FTO expression by the transcription factor MYC in GC. (A) Immunoblotting of MYC protein levels in EBVaGC cells and EBVnGC cells. (B) Correlation of EBNA1 (left) and FTO (right) with MYC mRNA expression in 62 EBVaGC samples from SYSUCC. (C and D) RT‐qPCR analysis of FTO mRNA levels in EBVaGC cells upon MYC overexpression (C) and MYC knockdown (D). (E and F) Western blotting was performed to assess FTO and MYC protein expression levels in EBVaGC cells with MYC up‐regulation (E) and MYC down‐regulation (F). (G and H) Luciferase reporter assay of FTO transcriptional activity in MYC‐overexpressing (G) and MYC‐knockdown (H) EBVaGC cells. (I) Schematic illustration showing the FTO promoter containing the predicted MYC‐binding sites (−1365 to −1354). The strategy for mutating the FTO promoter is to delete the binding sequences. (J) Agarose gel electrophoresis (top) and qPCR analysis (bottom) of the ChIP assay indicated the enrichment of MYC on the FTO promoter at the predicted region of −1365 to −1354 in EBVaGC cells. (K and L) Luciferase reporter assay showing the transcriptional activity of FTO in AGS B95.8 (K) and AGS AKATA (L) cells overexpressing the FTO wild type and truncation mutant. The data in (C, D, G, H, K and L) are presented as the means ± SDs. p‐Values were determined by Student's t test. *p < 0.05; **p < 0.01; ***p < 0.001. Vinculin was included as a loading control.