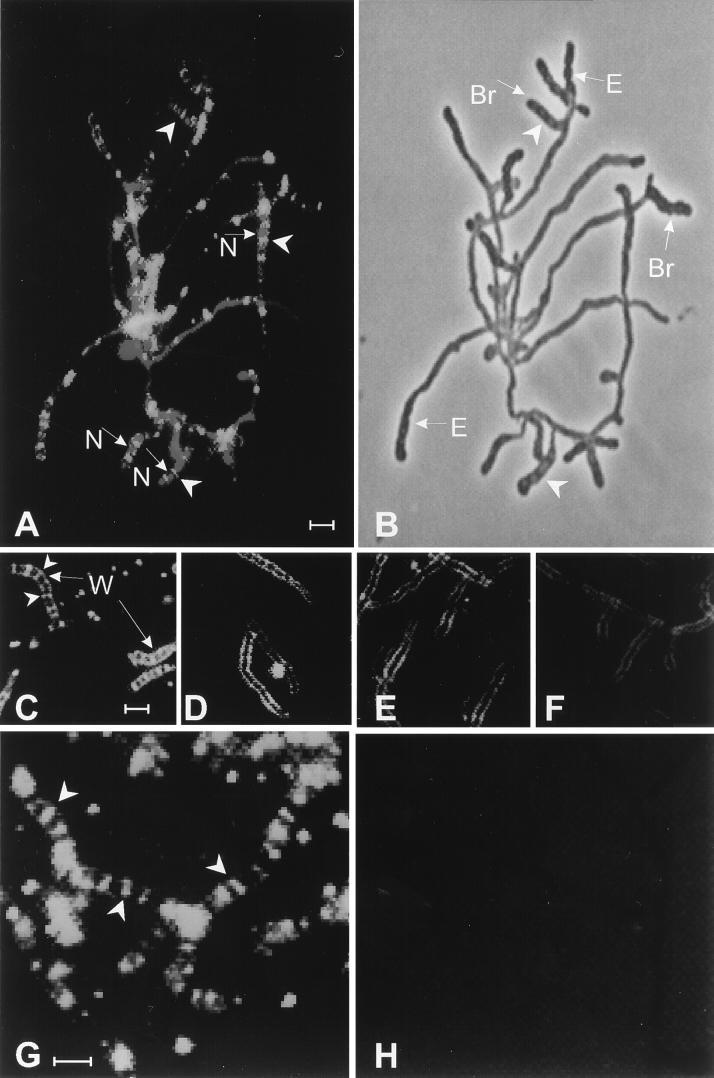
FIG. 5.
Visualization of PBPs by fluorescence microscopy. Cells of S. griseus that had been induced to sporulate for 12 h in the presence or absence of cefoxitin were exposed to Flu-conjugated β-lactams. (A) Flu-APA and propidium iodide. (B) Phase-contrast micrograph of the sample shown in panel A. (C) Flu-ACA. (D) Cefoxitin (6 μg/ml), then Flu-ACA. (E) Cefoxitin (20 μg/ml), then Flu-ACA. (F) Cefoxitin (60 μg/ml), then Flu-ACA. (G) Flu-APA. (H) Cefoxitin (6 μg/ml), then Flu-APA. Arrowheads in panels A, C, and G point to examples of Flu-tagged “ladders” in sporogenic hyphae. Arrowheads in panel B point to sporulation septa. The arrows marked “N” in panel A point to nucleoids stained with propidium iodide; in panel B, those marked “Br” point to sporogenic hyphae that emerged from new branches and those marked “E” point to sporogenic hyphae that formed by extension of preexisting vegetative hyphae. The arrows marked “W” in panel C point to Flu–ACA-labeled hyphal walls. Bar, 2 μm. The color version of this figure can be viewed at http://www.biosci.ohio-state.edu/~kek/html/j_bacteriol_1998.html.

