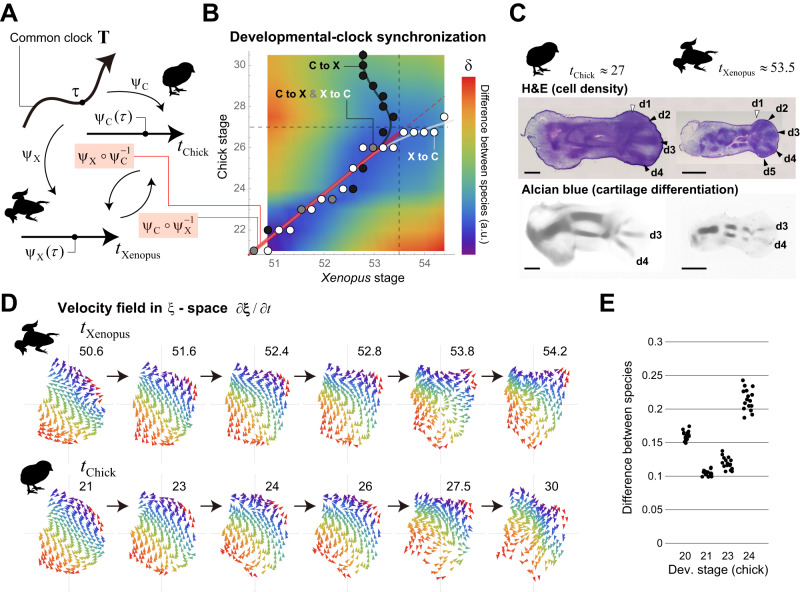
Fig. 4. Cross-species synchronization of developmental clocks.
A Definition of the common clock and relationship between developmental stages of different animals (see Methods for details). B Synchronization of the developmental clocks between Xenopus and chick. The color of the heatmap shows the distance of each pair of developmental stages (see Methods for details). The white and gray points/curve indicate the correspondence of each Xenopus stage to the closest chick stage, which defines the map . The black and gray points/curve shows the map . Around the ranges and , both stages correspond linearly and in a one-to-one manner (red segment). C (top) In terms of the spatial heterogeneity in cell density (Hematoxylin-Eosin (H&E) staining), digit patterning is well established by approximately tChick = 27 for chick and tXenopus = 53.5 for Xenopus. (bottom) The timing of cartilage differentiation (Alcian blue staining) is slightly delayed compared to the patterning of cell density. The black arrowheads indicate the already formed digit regions, while the white ones show the digit regions just beginning to form or that have yet to begin formation. d: digit. Scale bar: 500 μm. D Temporal changes in the cell velocity fields for both species. Until the stage at which anatomical patterning is well established, the orientation pattern of cell flow in the ξ space, especially in the internal tissues, is very similar between the species. In contrast, at later stages, differences in the orientation pattern become more pronounced (see also Supplementary Fig. 3). Each pair of (tXenopus, tChick) = (50.6, 21), (51.6, 23), (52.4, 24), (52.8, 26) represents almost the same timepoint of the common clock. E Dependence of the agreement in cell trajectories in the ξ-space between species on the selection of initial stages; we tested the initial time point for Xenopus, which was fixed at tXenopus = 50.6, and the four initial time points for chick which were tChick = 20, 21, 23, 24. (Median, SD) = (0.160, 0.0067), (0.103, 0.0044), (0.118, 0.0090), (0.213,0.0162) for tChick = 20, 21, 23, 24, respectively. See Methods for details including information on SD and Supplementary Fig. 4 for the case in which the initial time point for chick was fixed. Source data are provided as a Source Data file.

