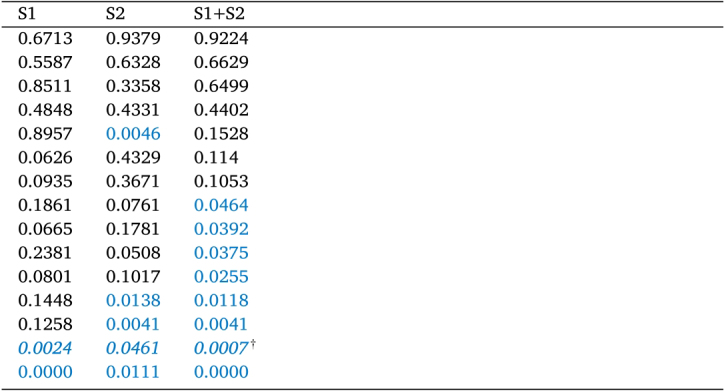
Table 1.
Individual p-values from Wilcoxon rank-sum tests for session 1 (S1), session 2 (S2), and both sessions together (S1+S2). Subjects are ordered by the -value for both sessions (S1+S2). Note that the sample-size is naturally smaller within the single session compared to taking both sessions together. P-values significant with a 5%-significance-level are highlighted in blue. The outlier subject for whom 71% of trials were removed due to pre-innervation is marked by italicization and dagger.

