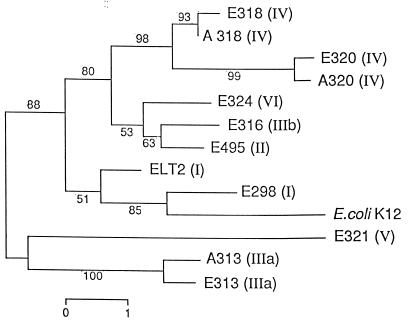
FIG. 3.
Dendrogram based on ISR1 sequences showing the relationships among E. coli K-12 and representatives of S. enterica subspecies. The tree was constructed by the neighbor-joining method. Boot-strap values were calculated from 500 trees. Each number on a branch indicates the percentage of trees in which the node was supported. Bar, percent sequence divergence.

