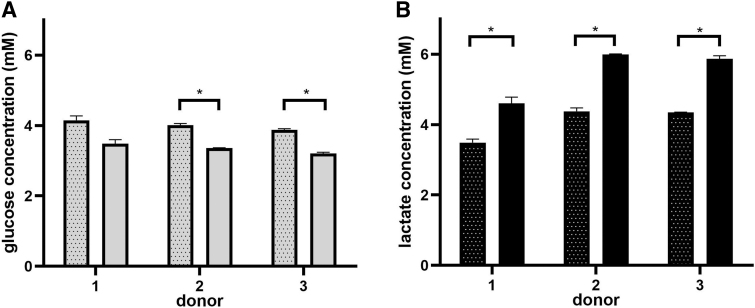
FIG. 5.
Glucose and lactate concentration over culture time for three different donors. (A) Glucose concentration; (B) lactate concentration. Dotted bars refer to 24 h, while filled bars refer to 48-h culture time. Results are presented as mean ± SEM of at least two technical replicates (*p < 0.05).

