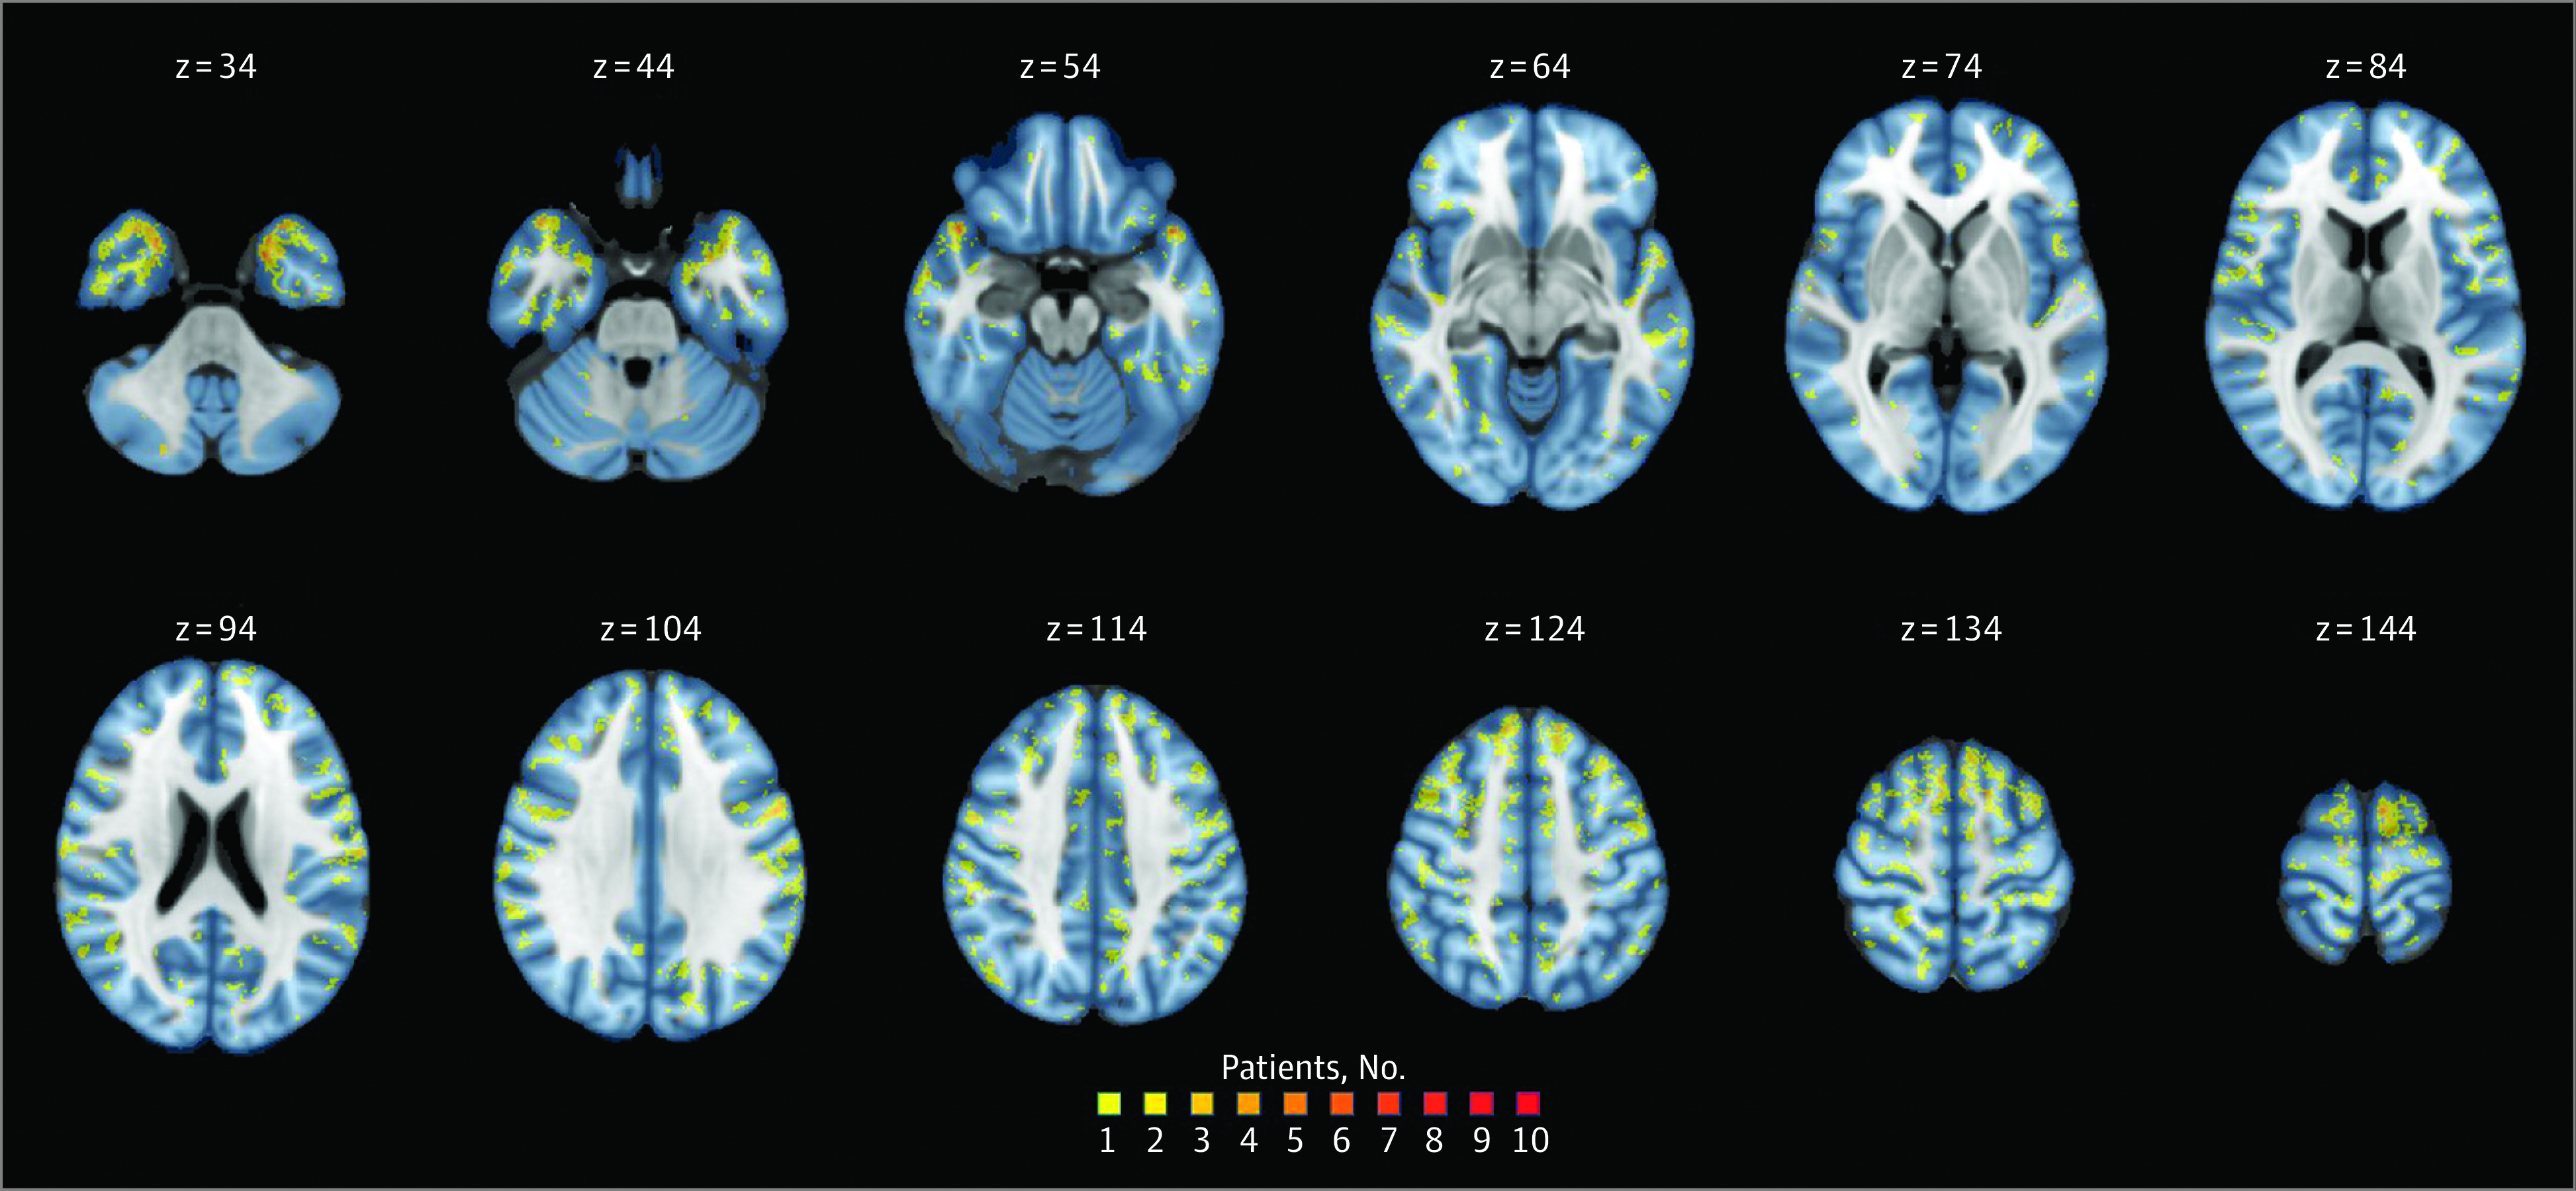
Figure 2. Cortical Lesion Probability Map in Patients With Multiple Sclerosis (MS)/Clinically Isolated Syndrome (CIS).

The number of patients with MS/CIS presenting lesions in each cortical voxel is displayed in different colors, according to the reported color heat map. z indicates the z-axis coordinate of the Montreal Neurological Institute (MNI) 152 space.
