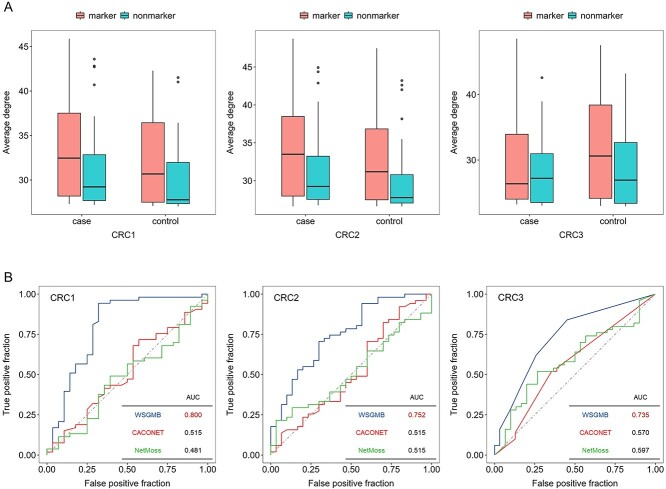
Figure 5.
A Average degree of nodes in 500 co-occurrence networks for cases and controls from three CRC studies. Orange represents microbial markers in the gutMDisorder database, and blue represents other bacteria. B Prediction power of three methods in three CRC studies. The red AUC value shows the best prediction of each study across three methods.

