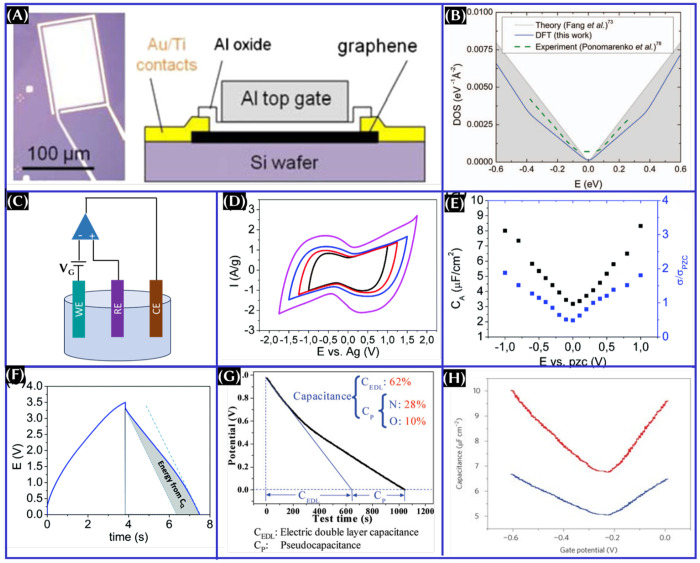
Figure 17.
(A) Schematic of the graphene–Al2O3–Al capacitor. This panel was reproduced with permission from ref (117). Copyright 2010 American Physical Society. (B) Comparison of density of states of graphene from theory, experiment, and DFT. This panel was reproduced with permission from ref (28). Copyright 2012 IOP Publishing, Ltd. (C) Schematic of the quantum capacitance measurement setup for the graphene electrode.118 (D) CV at 50 mV/s at different voltage limits, (E) area-normalized capacitance and normalized conductivity versus potential at zero charge obtained from electrochemical impedance at 10 mHz and different bias voltages, and (F) charge–discharge profile of the symmetric device made with macroscopic fibers of CNTs as electrodes and 1-butyl-3-methylpyrrolidinium bis(trifluoromethylsulfonyl)imide (PYR14TFSI) as the ionic liquid electrolyte used. These panels were reproduced with permission from ref (119). Copyright 2016 Royal Society of Chemistry. (G) Capacitive contribution from nitrogen-enriched nanocarbons with a 3D continuous mesopore structure. This panel was reproduced with permission from ref (120). Copyright 2010 American Chemical Society. (H) Total capacitance (blue line) and quantum capacitance (red line) of graphene can be measured with the measurement setup presented in panel C. This panel was reproduced with permission from ref (118). Copyright 2009 Nature Publishing Group.

