Figure 2.
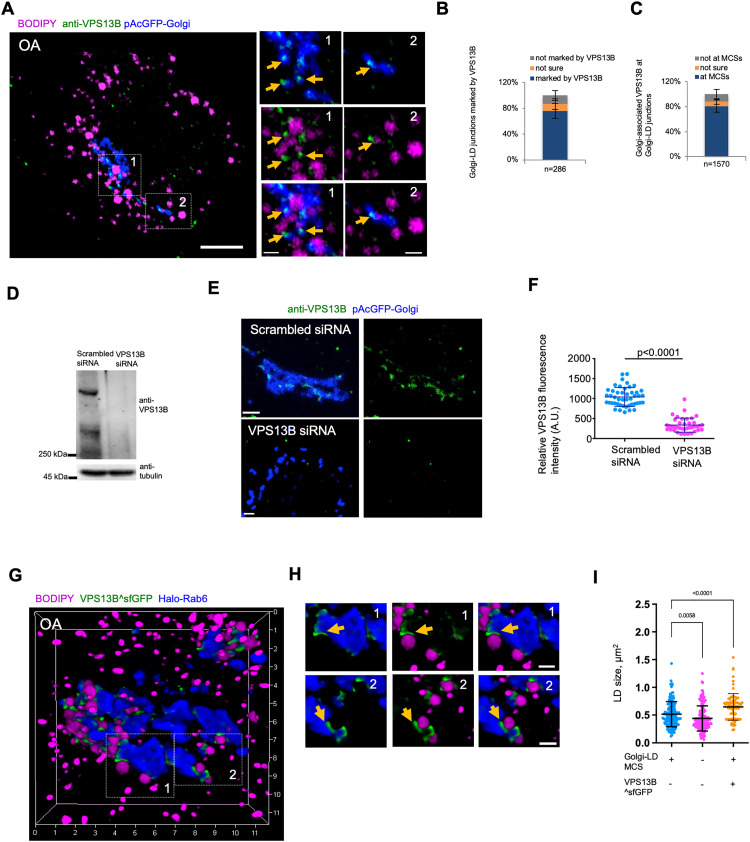
VPS13B localizes to Golgi-LD MCSs. (A) Airyscan images of fixed BODIPY558/568 (magenta)-labeled HEK293 cells expressing pAcGFP-Golgi (blue) in IF with anti-VPS13B antibody (green). Yellow arrows denoted endogenous VPS13B foci adjacent to Golgi-LD junctions. (B) Percentage of Golgi-LD junctions (n = 286 from 20 cells) marked with endogenous VPS13B. Mean ± SD. (C) Percentage of Golgi-associated, endogenous VPS13B puncta or enrichments (n = 1570 from 20 cells) at Golgi-LD junctions. Mean ± SD. (D) Western blots demonstrated the efficiency of siRNA-mediated VPS13B suppression. (E) Confocal images of scrambled (top panel) or VPS13B siRNAs treated (bottom panel) HeLa cells expressing pAcGFP-Golgi (blue) in IF by anti-VPS13B antibody (green). Contrast range of images was set to same level for both cells. (F) Quantification of VPS13B fluorescence intensity in IF of scrambled (n = 46) or VPS13B siRNAs (n = 39) treated cells. Mean ± SD. Two-tailed unpaired Student t-test. (G, H) High-resolution 3D image of a BODIPY558/568 (magenta)-labeled HEK293 cell expressing VPS13B^sfGFP (green) and Halo-Rab6 (blue), with two insets from boxed regions with yellow arrows denoting specific enrichment of VPS13B^sfGFP at Golgi-LD MCSs. (I) Quantification of the size of LDs at the Golgi-LD junctions (n = 157, 24 cells), LDs not at junctions (n = 167, 24 cells) or LDs at VPS13B^sfGFP-marked junctions in cells expressing VPS13B^sfGFP (87, 13 cells). Mean ± SD. Two-tailed unpaired Student t-test. Scale bar, 10 μm in (A) and 2 μm in insets in (A, E, and H).

