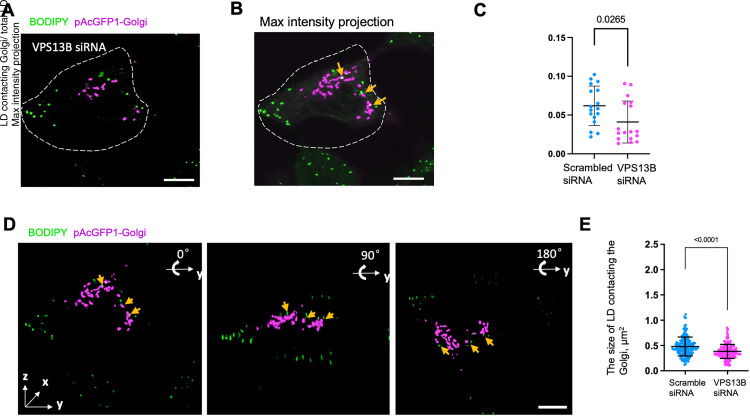
Figure 4.
The Golgi-LD interactions in VPS13B-depleted cells. (A) Representative confocal images of a BODIPY 558/568 (green)-labeled HeLa cell expressing pAcGFP1-Golgi (magenta) upon treatments of VPS13B siRNAs. (B) The maximum intensity projections of 3D reconstructions of the VPS13B-depleted cell in (A) showing possible Golgi-LD interactions. (C) Quantification of Golgi-LD interactions in BODIPY558/568-labeled cells expressing pAcGFP-Golgi in response to either scrambled (n = 17) or VPS13B siRNAs (n = 17). Mean ± SD. Two-tailed unpaired Student t-test. (D) 3D images of the VPS13B-depleted cell in (A) with three different angles (0°, 90°, and 180°) rotating along with y-axis were shown. A stack of 26 z-planes with 0.19-μm thickness in each stack was taken. Yellow arrows denoted LDs adjacent but not physically contacting the Golgi. (E) Quantification the size of LD adjacent to the Golgi in BODIPY558/568-labeled cells in response to either scrambled (n = 17) or VPS13B siRNAs (n = 17). Mean ± SD. Two-tailed unpaired Student t-test. Scale bar, 10 μm in whole cell image and 1 μm in insets in (A); 2 μm in insets in (B–D).

