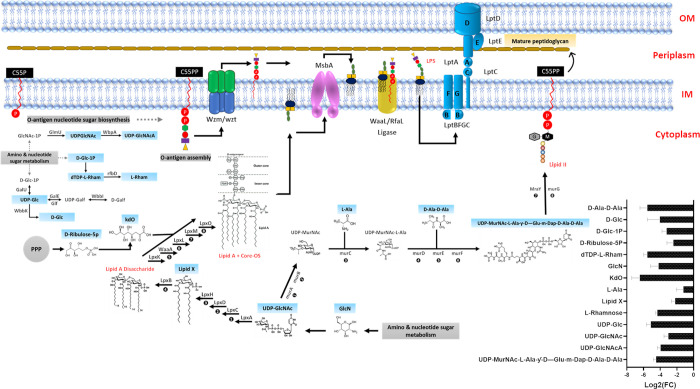
Figure 3.
Comparative metabolome mapping of PDR K. pneumoniae FADD-KP070 responses to treatment with ceftazidime/avibactam (48/4 mg/L) at 6 h (log2FC ≥ 0.59 or ≤ −0.59, p < 0.05). Schematic and bar chart representations of all significantly affected metabolites involved in lipopolysaccharide (LPS) and O-antigen assembly. Blue rectangles represent the downregulated metabolites. UDP-GlcNAcA = UDP-N-acetyl-2-amino-2-deoxy-d-glucuronate.

