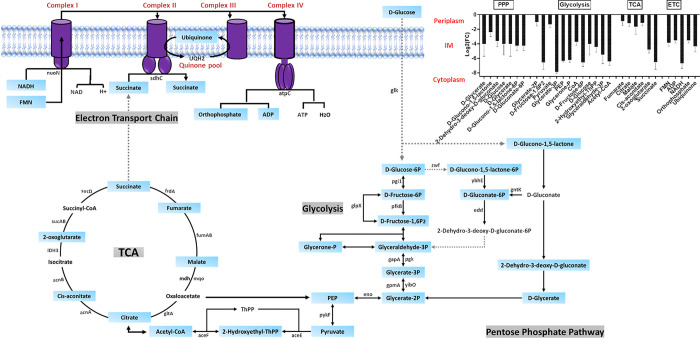
Figure 5.
Schematic pathway diagram depicting significantly influenced precursors of the complex interplay metabolic pathways of central carbon metabolism [glycolysis, pentose phosphate pathway (PPP), tricarboxylic acid (TCA) cycle, and electron transport chain (ETC)] of K. pneumoniae FADDI-KP070 after ceftazidime/avibactam treatment at 6 h (log2FC ≥ 0.59 or ≤ −0.59, p < 0.05). Blue rectangles represent the suppressed metabolites.

