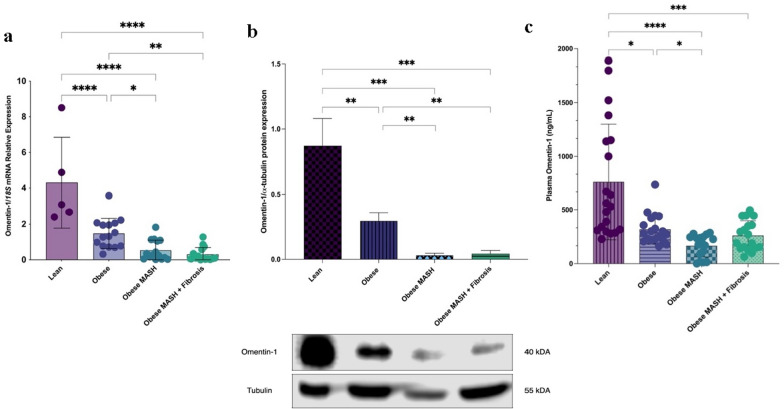
Fig. 1.
Human VAT omentin-1 a mRNA expression, b protein expression, and c plasma levels in obese groups and lean controls. Omentin-1 mRNA expression is significantly decreased in the VAT of all obese groups as compared to the lean controls (N = 60). Representative blot and densitometric analysis of omentin-1 normalized to α-tubulin revealed that protein expression is also significantly decreased in the VAT of all obese groups as compared to the lean controls (n = 3/group). For plasma levels, values presented are the mean ± SD of individual patients (N = 72). Group comparison by Kruskal–Wallis and post hoc Dunn’s test. *p < 0.05, **p < 0.01, ***p < 0.001, ****p < 0.0001

