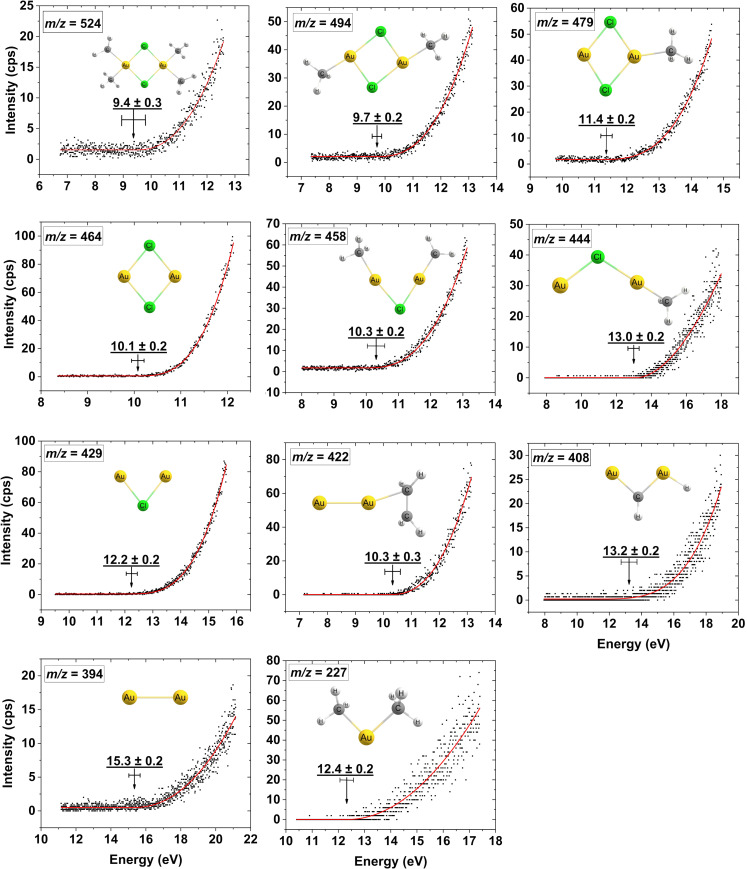
Figure 7.
Representative fits to the onset region of the DI ion yield curves for the parent cation and the most dominant positively charged fragments from [Au(CH3)2Cl]2. The appearance energies and their confidence limits for each ion are shown along with the respective chemical structure optimized at the PBE0-TZVP level of theory.

