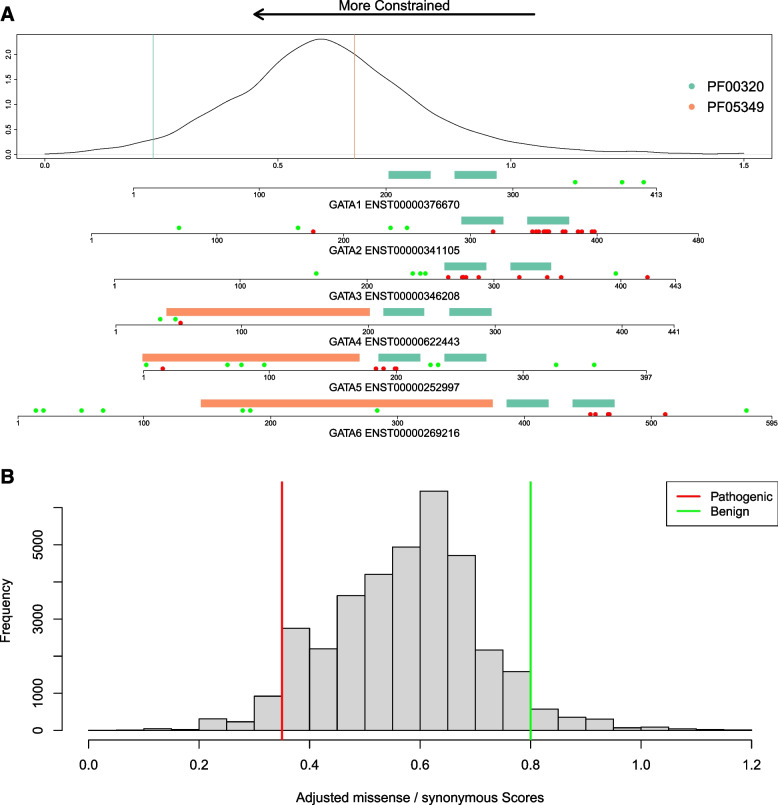
Fig. 2.
Score distribution and thresholds for meta-domain constraint. a Example of domain structure and meta-domain constraint for six related proteins, GATA1-6. The density plot shows the distribution of the adjusted m/s constraint scores for all PFam domains, and the coloured vertical lines correspond to the specific domains within the GATA1-6 proteins (GATA zinc finger domain, PF00320 = green; GATA-type transcription activator N-terminal domain, PF05349 = orange), all of which have been implicated in monogenic diseases. Below the density plot, a separate (N-terminal aligned) plot is shown for each protein, showing locations of the PFam domains (coloured as above), and ClinVar benign/likely benign (green) and pathogenic/likely pathogenic variants (red). b Histogram showing the distribution of adjusted m/s scores in the ClinVar pathogenic and benign missense variant dataset. Vertical lines indicate pathogenic (red) and benign (green) thresholds for the PP2 analysis

