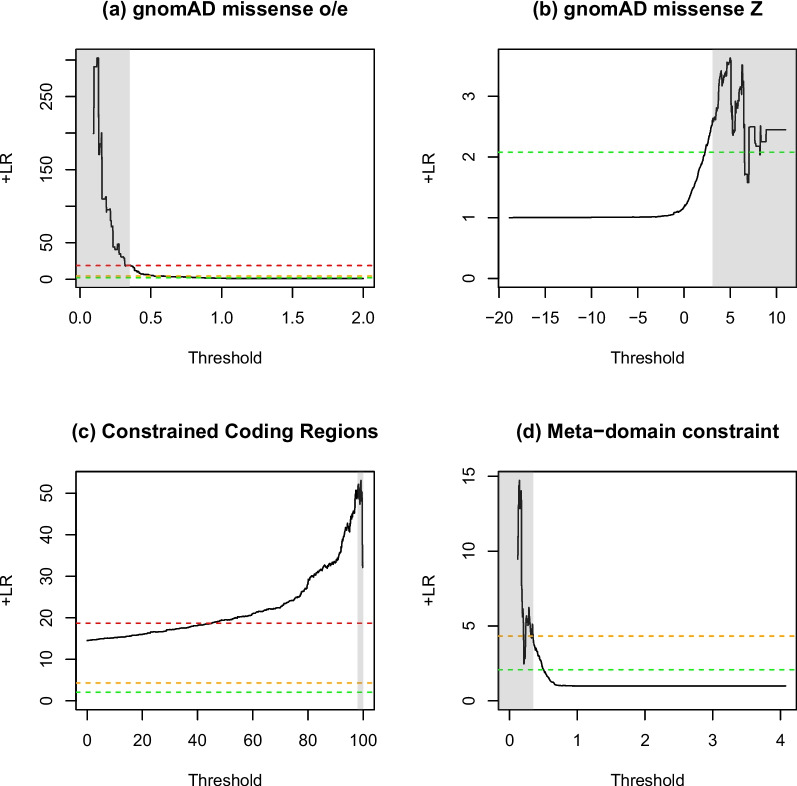
Fig. 3.
Positive likelihood ratio curves for constraint metrics. The effect on the positive likelihood ratio (y-axis) based on the tool threshold (x-axis) for a gnomAD missense_oe, b gnomAD missense_Z, c small constrained coding regions (CCR) and d adjusted m/s meta-domain constraint. Each analysis was done 1000 times with equal steps between the minimum and maximum values. Vertical shading indicates tool-specific thresholds for pathogenicity (see Table 2) and horizontal dotted lines indicate likelihood ratio thresholds for pathogenic variant classification from Tavtigian et al. (2018) (green = supporting, amber = moderate, red = strong)

