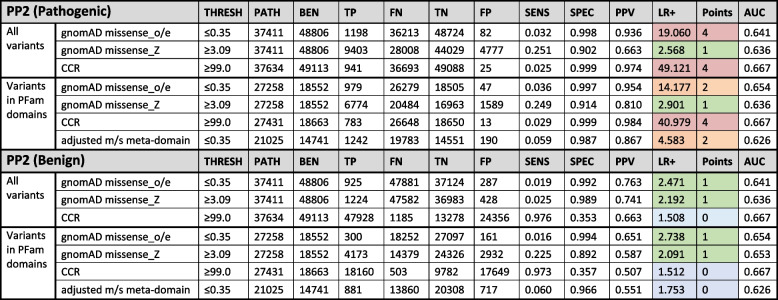
Table 2.
Performance of PP2 pathogenic (top) and benign (bottom) analysis for five genetic constraint metrics
Shading in the LR+ and points columns indicates the strength reached for classification purposes according to Tavtigian et al. (2018) and Tavtigian et al. (2020) (red = strong; amber = moderate; green = supporting; blue = below minimum evidence weighting). gnomAD missense_o/e, observed/expected missense variants from gnomAD, CCR Constrained coding regions from Havrilla et al. (2019), THRESH Tool-specific threshold, PATH Number of pathogenic variants, BEN Number of benign variants, TP True positive, FN False negative, TN True negative, FP False positive, SENS Sensitivity, SPEC Specificity, PPV Positive predictive value, LR+ Positive likelihood ratio, AUC Area under the ROC curve (calculated in R using the pROC library)

