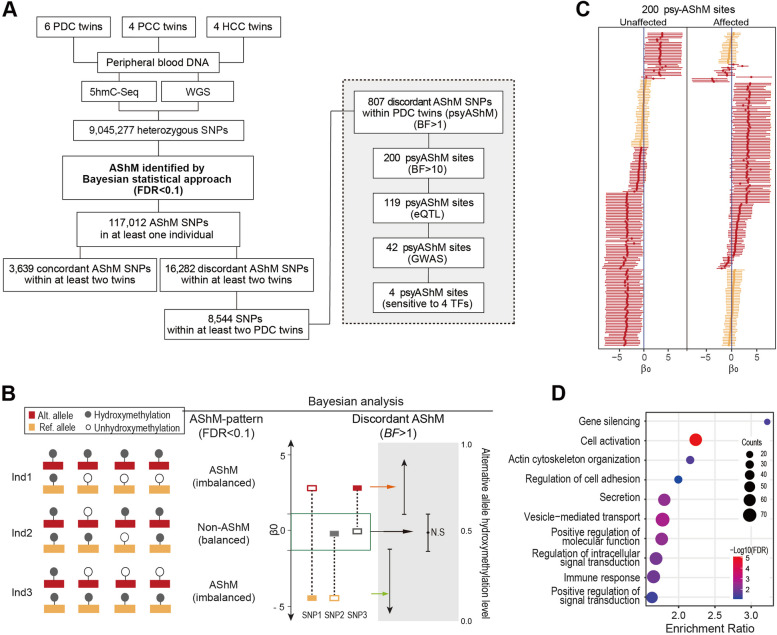
Fig 1.
Schematic describing the method of detecting AShM in MZ twin pairs. A A schematic of the pipeline for the analysis of AShM. B Calling allelic imbalances. Allelic DNA hydroxymethylation patterns are shown in the left panel. Discordant AShM sites in twin pairs were determined by Bayesian analysis. C Estimates of 200 discordant AShM sites in PDC twin pairs. Each point represents the β0 value of the psyAShM sites showing the greatest evidence of AShM in unaffected or affected individuals (highlighted in red, p<1e−10) and the discordant AShM pattern within PDC twin pairs (BF>10). Error bars indicate 95% credible intervals. D Functional enrichment of GO-Biological process (GO-BP) annotations of 807 psyAShM sites

