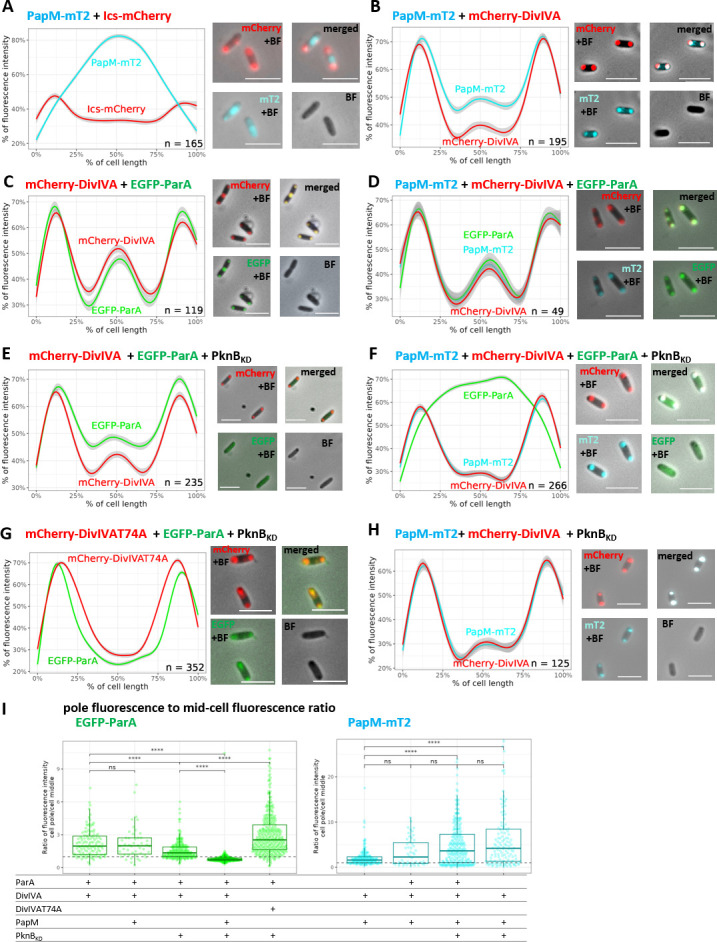
Fig 2.

Phosphorylation enhances PapM binding to DivIVA while diminishing ParA recruitment to DivIVA in E. coli. (A) Colocalization of PapM-mTurquoise2 (MT2) with Ics-mCherry. (B) Colocalization of PapM-mT2 with mCherry-DivIVA. (C) Colocalization of mCherry-DivIVA and EGFP-ParA. (D) Colocalization of mCherry-DivIVA, EGFP-ParA and PapM-mT2. (E) Colocalization EGFP-ParA with mCherry-DivIVA in presence of His-PknBKD. (F) Colocalization of mCherry-DivIVA, EGFP-ParA, and PapM-mT2 in the presence of His-PknBKD. (G) Colocalization of phosphoablative mCherry-DivIVAT74A variant and EGFP-ParA in the presence of His-PknBKD. (H) Colocalization of PapM-mT2 with mCherry-DivIVA in the presence of His-PknBKD. Left panels show the profiles of fluorescence measured along the E. coli BL21 cells, and the right panels show the representative images of E. coli cells producing EGFP-ParA (green), mCherry-DivIVA (red), and PapM-mT2 (blue). The number of the cells used for analysis (n) is indicated in the plots; scale bar, 5 µm. (I) The ratio of EGFP-ParA (left panel) and PapM-mT2 (right panel) fluorescence at the pole to the fluorescence at the mid-cell. The ratio higher than 1 (dashed line) means more fluorescence signal at the poles; the ratio lower than 1 illustrates the fluorescence in the mid-cell. The data come from at least two independent biological replicates. The statistical significance between strains determined by Wilcoxon test (two-sided) with Holm method used for multiple comparisons is marked with asterisks: P-values ≤0.05 (*), ≤0.01 (**), ≤0.001 (***), and ≤0.0001 (****).
