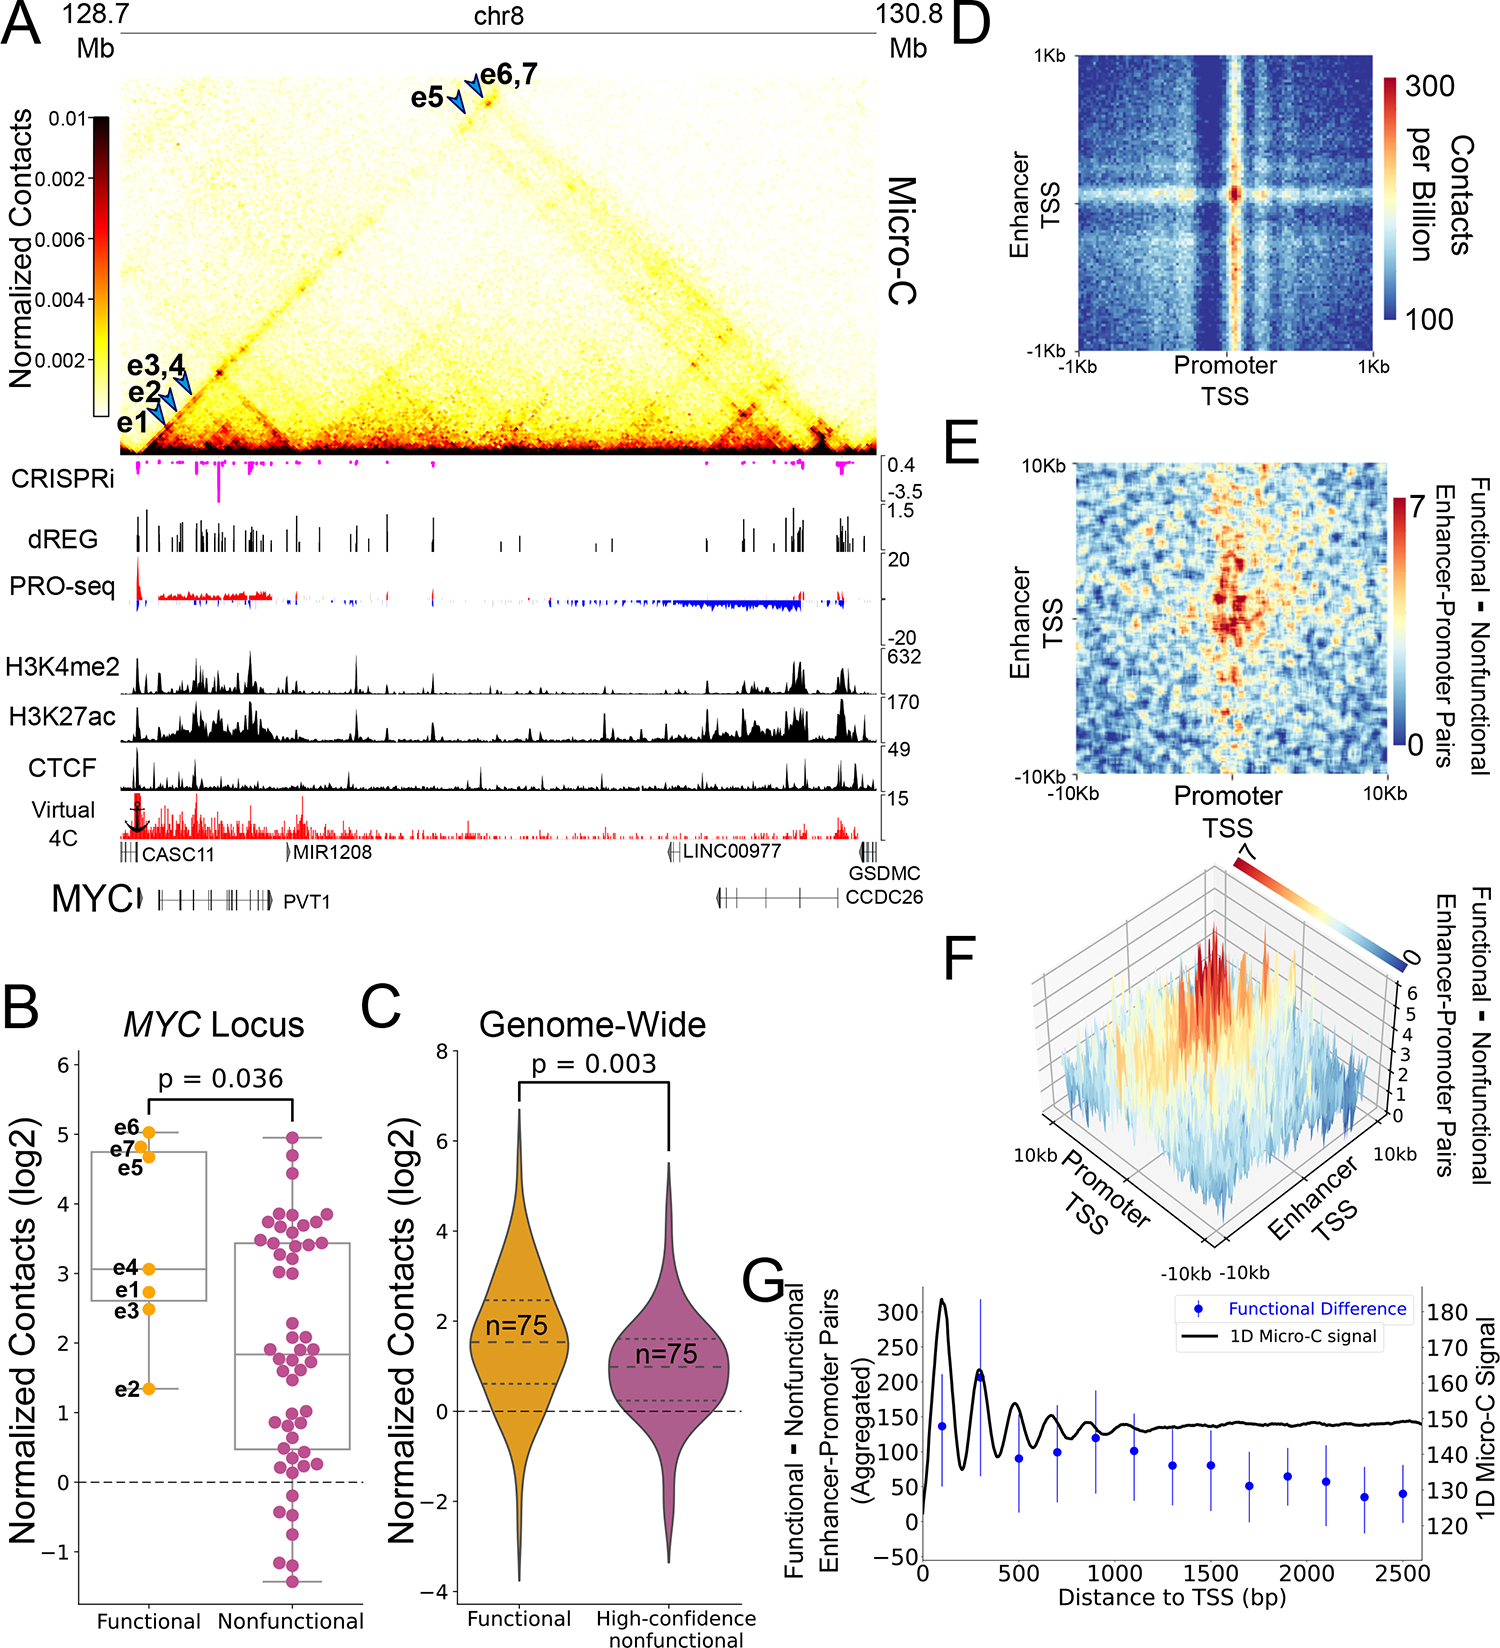
Figure 1. Micro-C contacts are enriched in functional enhancer-promoter pairs.

(A) Genome browser tracks showing Micro-C contact maps, CRISPRi-associated changes in cell viability34, dREG-defined TIRs and input PRO-seq signal38, H3K4me2, H3K27ac82 and CTCF83 ChIP-seq signal and a 2D representation (virtual 4C) of Micro-C contacts with the MYC promoter. Blue arrows point to regions in the contacts map representing interaction between the seven CRISPRi-validated MYC enhancers and the MYC promoter (B) Box and dot plot comparing the observed contact frequency relative to expected by a local distance-decay function of the seven MYC enhancers (functional pairs, n=7) compared to other TIRs in the TAD (nonfunctional pairs, n=52) with the MYC promoter. Boxplots boxes show the median, and 25–75 inter quartile range (IQR) and the maximum length of the whiskers is 1.5 IQR. A two-sided Mann-Whitney U test P-value is indicated. (C) Violin-plot comparing contactss relative to expected by a local distance-decay function of functional and nonfunctional enhancer-promoter pairs in the genome33, matched for genomic distance, accessibility and target gene expression distributions. A two-sided Mann-Whitney U test P-value is indicated. (D) An APA for enhancer-promoter contacts at 2kb around the TSSs, oriented such that the gene TSS points to the right and the dominant TSS of the enhancer points upwards. Pixel size is 20bp square(E) APA representing the differences in contacts between functional and nonfunctional pairs based on CRISPRi, 33 oriented such that the gene TSS points to the right and the dominant TSS of the enhancer points upwards. The APA represents smoothed differences in contacts between functional and nonfunctional enhancer-promoter pairs at a region of 20kb around the TSS with original pixel size of 100bp square. (F) A 3D representation of the APA from (E). (G) Blue - dot and error plot showing the median aggregated difference between the 245 functional and 232 high-confidence nonfunctional enhancer-promoter pairs (dot), and associated 95% confidence interval of that median in enhancer-promoter contacts of the +1 and +2 nucleosomes (400bp downstream to the TSS). Black - one dimensional contact signal downstream to enhancers and promoters. Total median signal was smoothed using a sliding window of 100bp.
