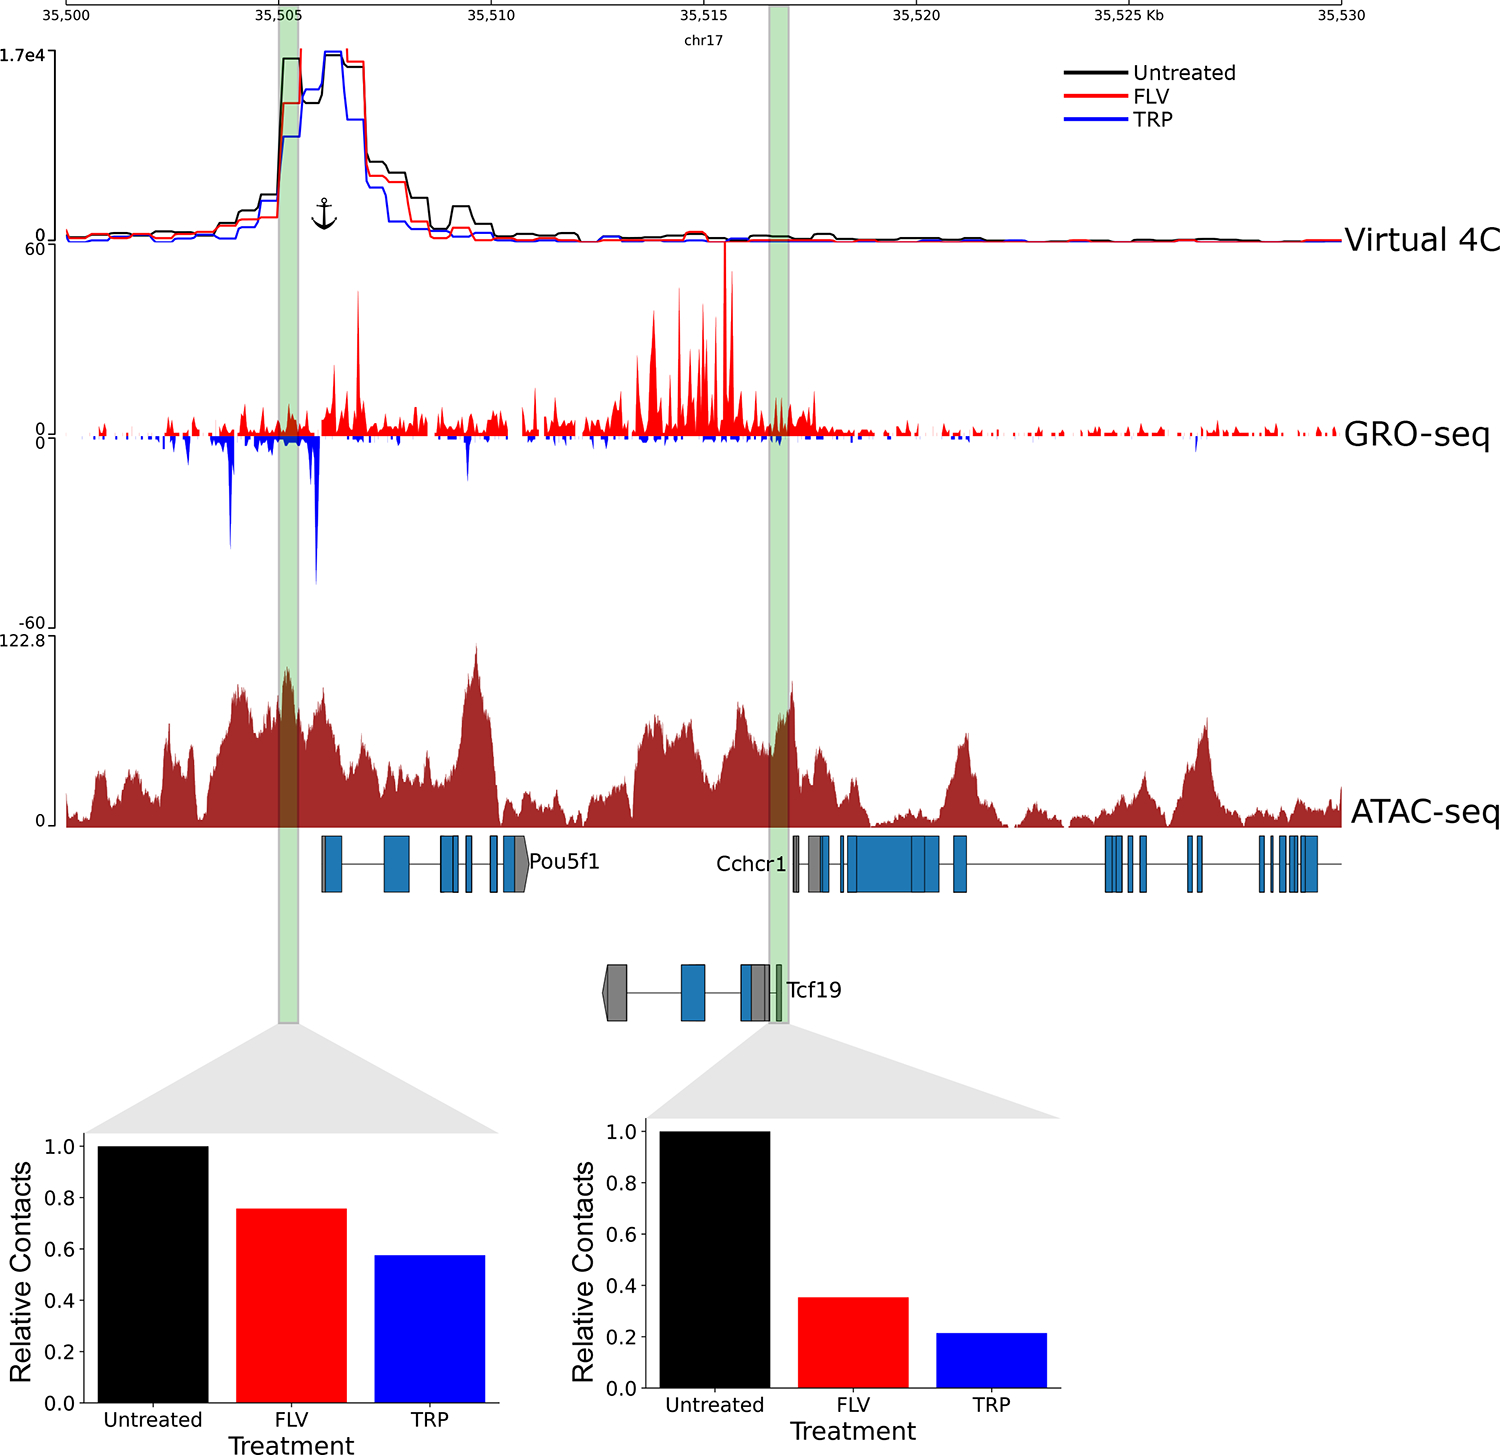
Extended Data Figure 7. Changes in enhancer-promoter contacts at the Pou5f1 locus following transcriptional inhibition.

Virtual 4C signal showing Micro-C signal associated with Pou5f1 promoter from a ~1.3 billion contacts library of untreated mESC, as well as the FLV and TRP treated mESCs (~400 million contacts each). Shown are also GRO-seq and ATAC-seq signals. Two regulatory elements shown to induce Pou5f1 gene expression53 are shown in green and the relative contacts between these regulatory elements and the Pou5f1 promoter, relative to the untreated control, in each treatment are shown in the associated bar plots. The position of the anchor for the virtual 4C is shown.
