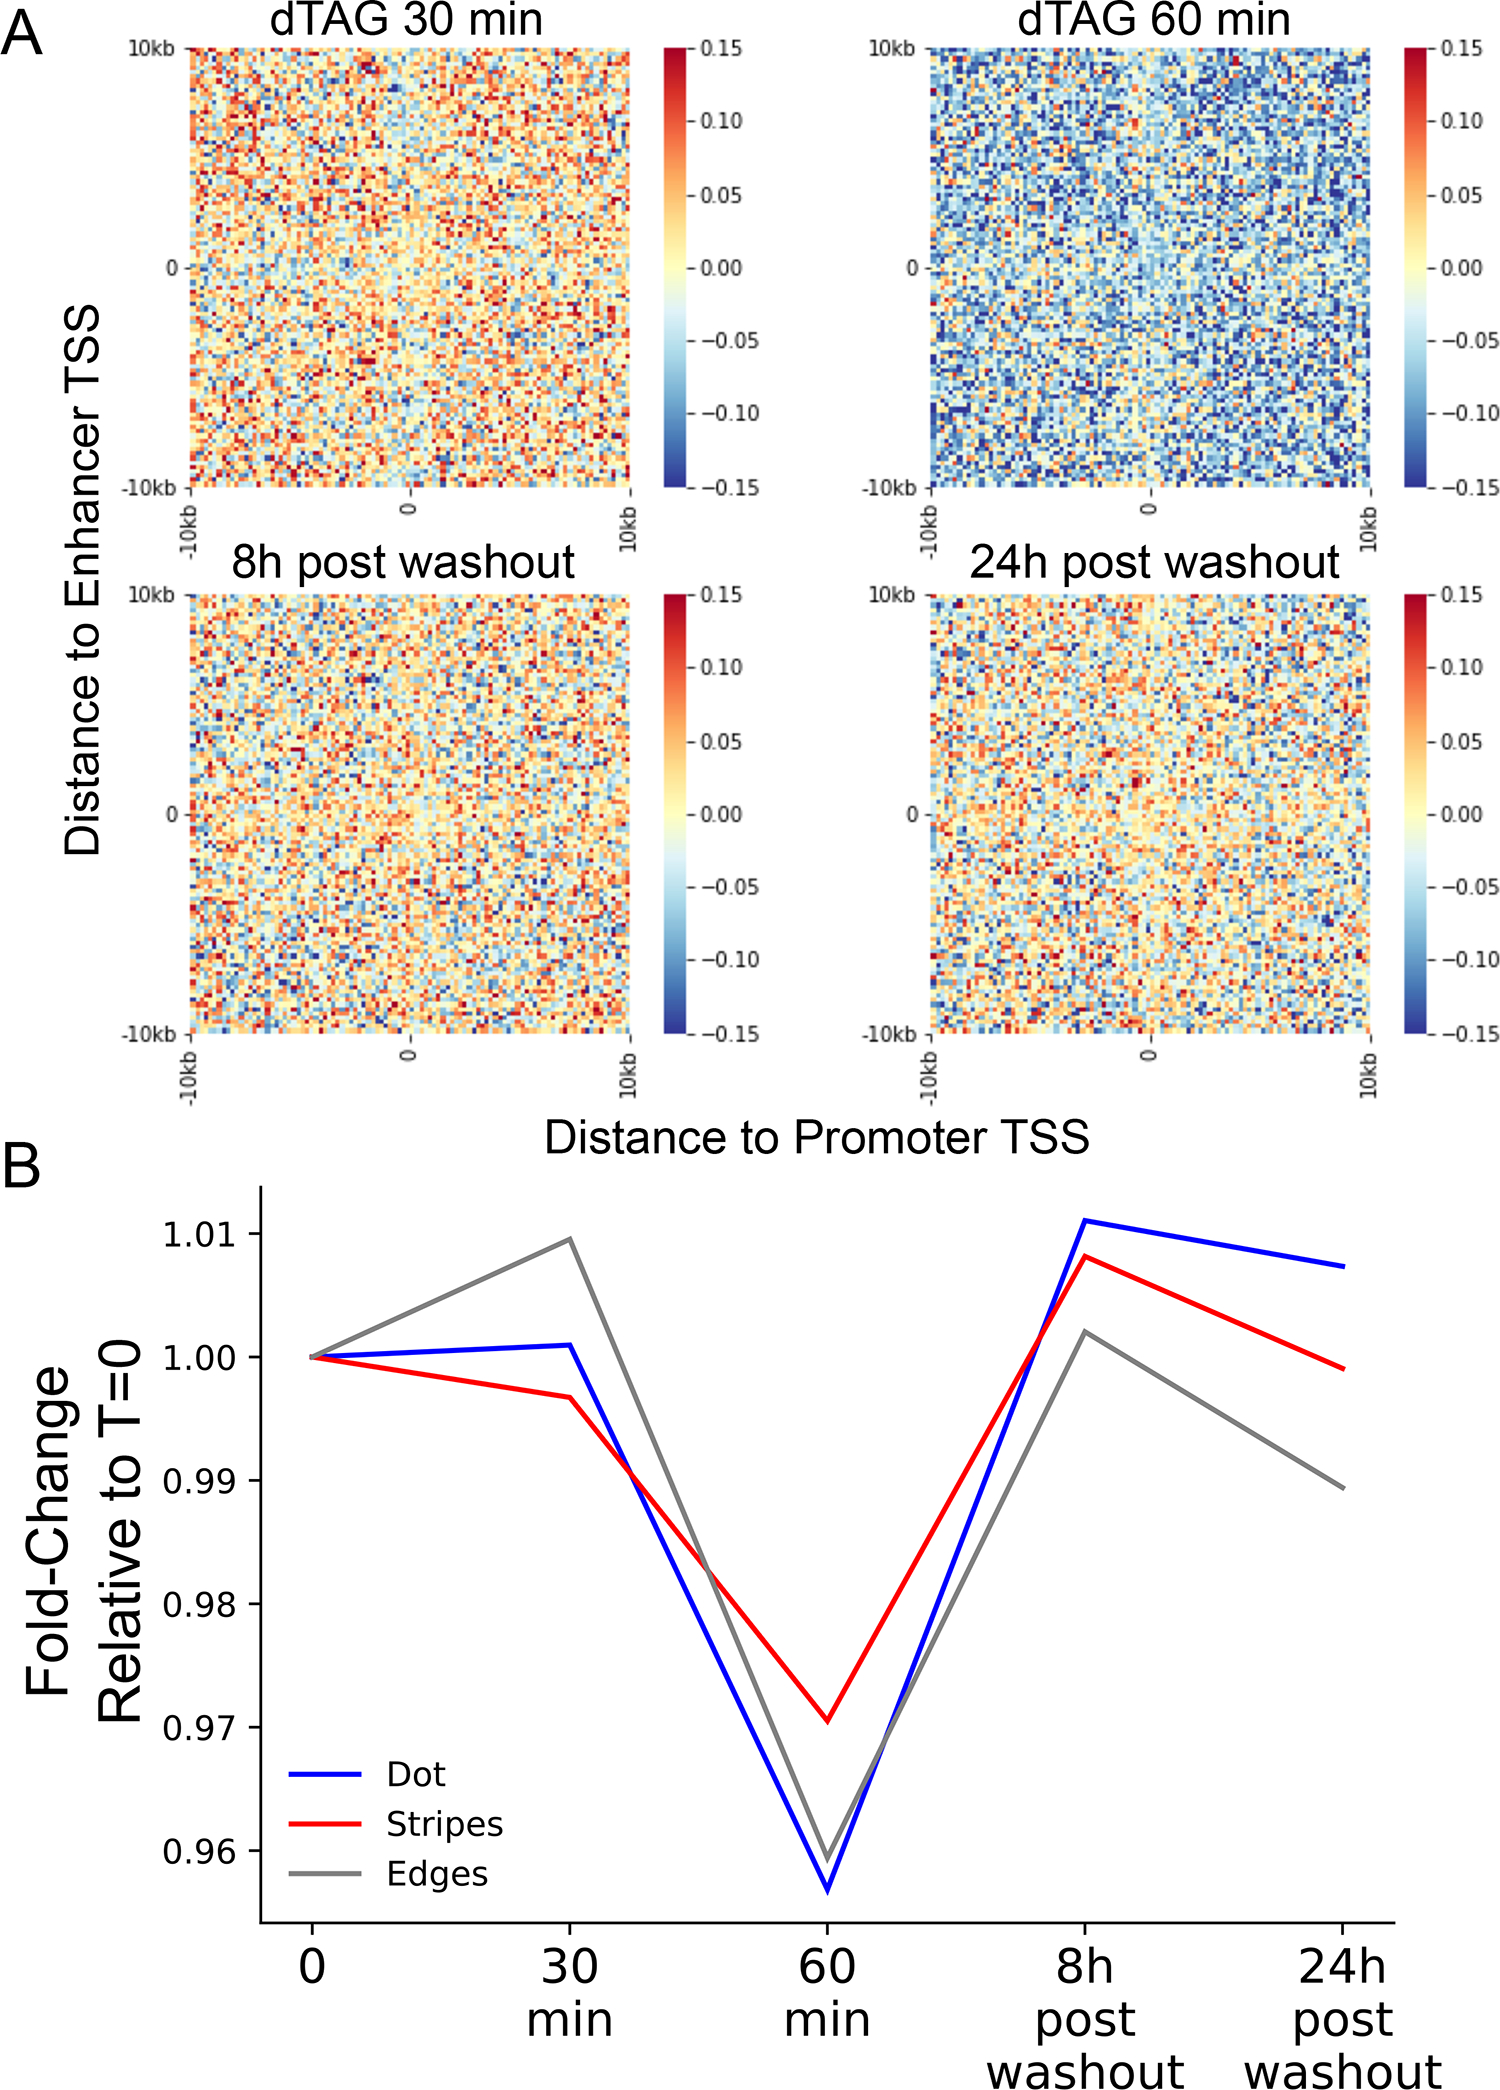
Extended Data Figure 9. Changes in enhance-promoter contacts architecture following NELFB depletion.

(A) APA heatmaps of the 1D change-normalized contact change (log2) between enhancer and promoter regions at 20kb around TSSs. Pixel size is 200 bp square. The APA heatmaps are oriented such that the gene TSS points to the right and the dominant TSS of the enhancer points upwards. (B) Line plot of the median fold changes at the dot (blue), stripes (red) and edges (gray) relative to T=0 at the different time points of dTAG treatments and following dTAG washout.
