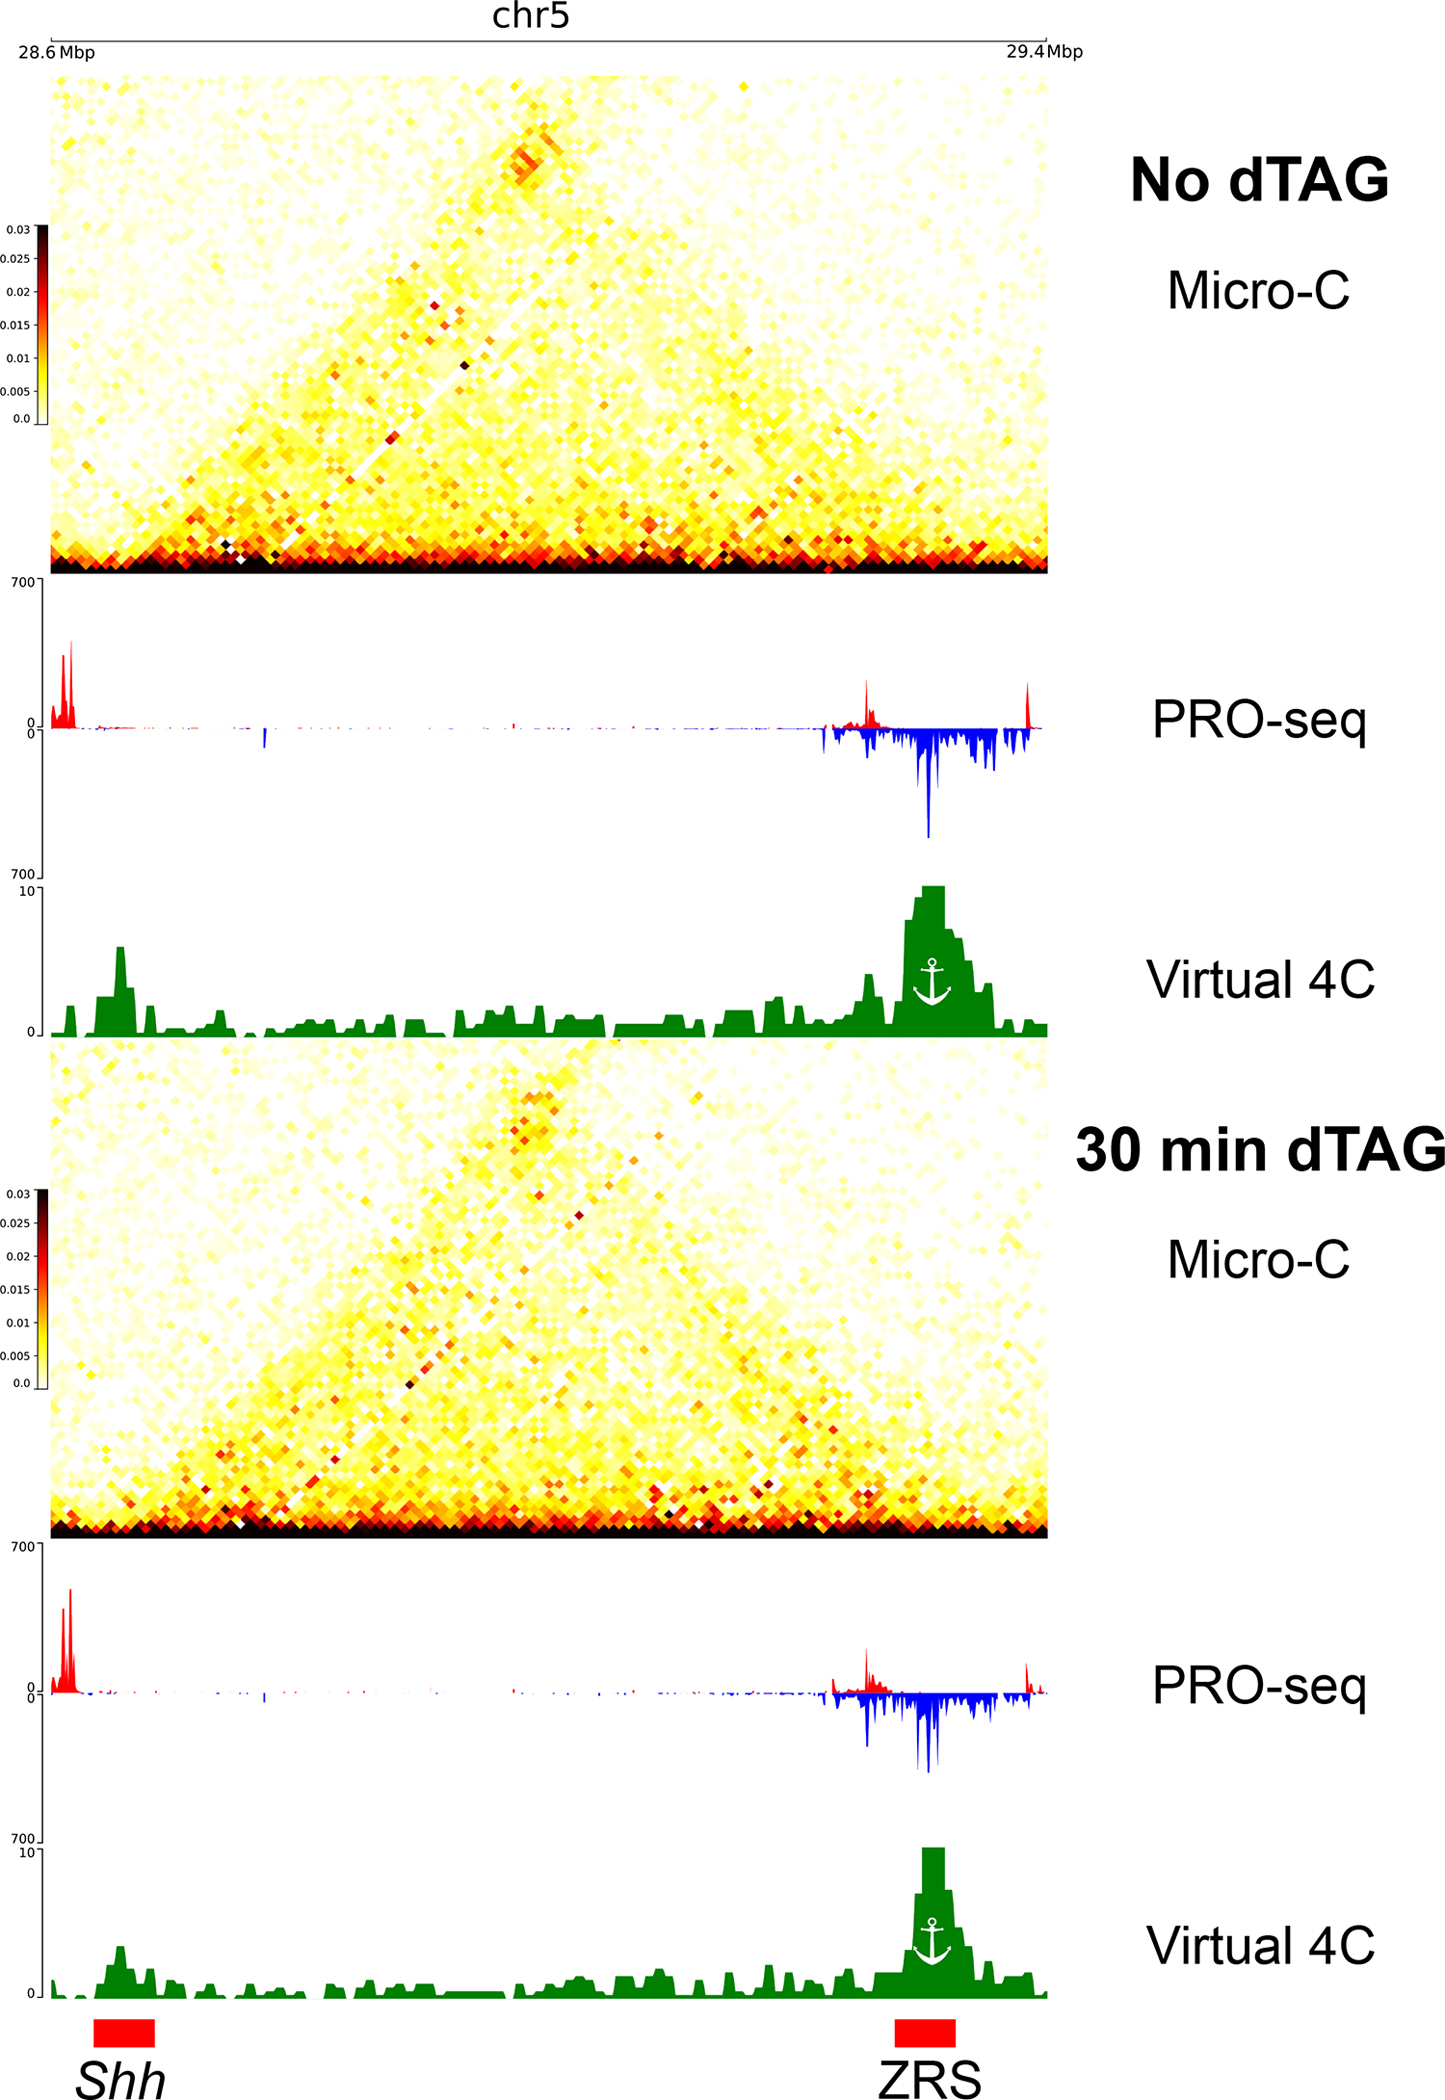
Extended Data Figure 10. Changes in ZRS-Shh contacts following NELFB depletion.

Micro-C contact maps in 10kb resolution along with the associated virtual 4C signal and PRO-seq signal in mESCs not treated (top) or treated (bottom) with the dTAG ligand for 30 minutes to degrade NELFB. The positions of the ZRS enhancer and the Shh promoter are indicated in red rectangles.
