
Figure 3. Changes in Pol II pausing and gene body density correlate with enhancer-promoter contacts.
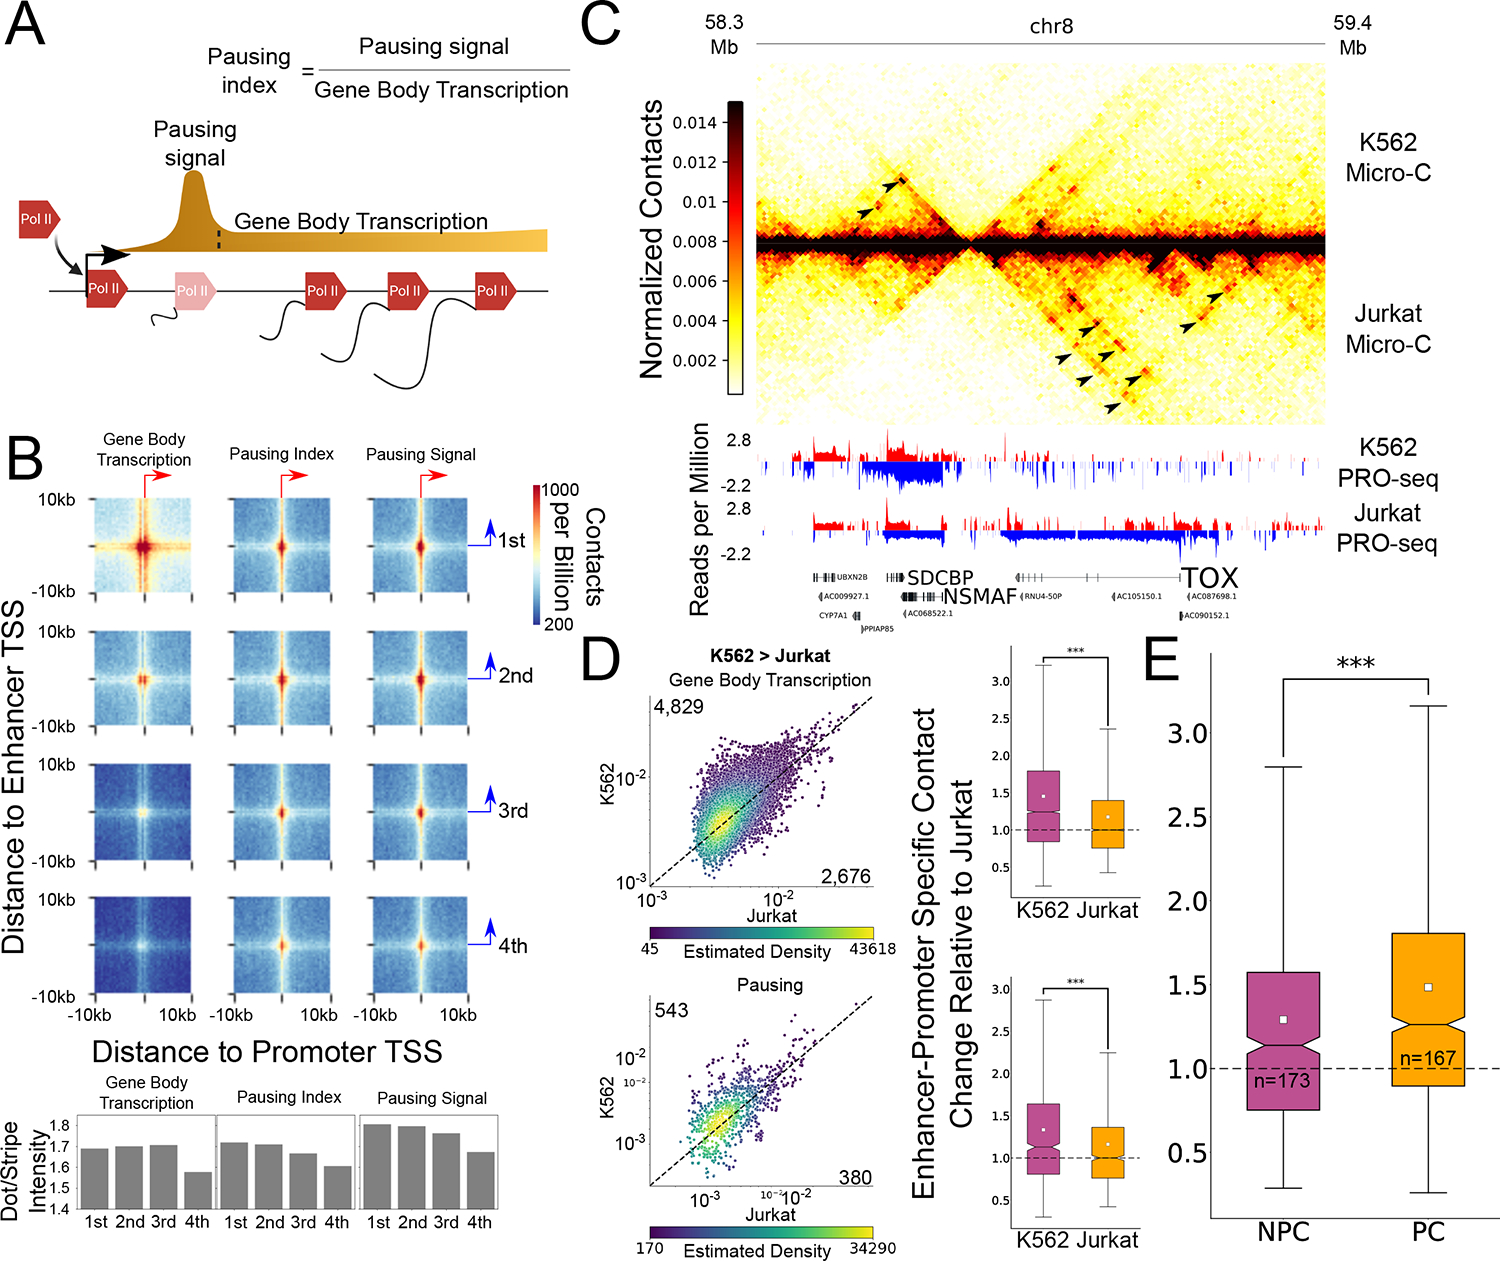
(A) Schematic representation of gene transcription from initiation, pausing and productive elongation at the gene body. The definitions for the PRO-seq signal at the pause peak and gene body, as well as the calculated pausing index for this analysis, are illustrated. (B) APA heatmaps show enhancer-promoter contacts associated with promoters of four gene body transcription (left), pausing index (middle) and pause peak signal (right) quartiles. Bar-plots demonstrate the ratios between the dot- and stripe-associated contacts. All APAs are centered on the max transcription start site of the gene (x-axis) and enhancer (y-axis) and are oriented so that the primary TSS points to the right (gene) or upwards (enhancer), as denoted by the red and blue arrows. (C) Genome-browser shot of a 1.1Mb region containing the TOX and NSMAF genes. The Micro-C contact map pixel size is 10kb. Arrows indicate differential contacts associated with differential transcriptional activity in K56238 and Jurkat T-cells36. (D) Scatterplots where each dot represents a single enhancer-promoter pair where the promoter was associated with higher gene body transcription (top, n=7,505) and pausing signal (bottom, n=923) at K562 compared to Jurkat T cells. The numbers of pairs in which the ratio was higher in K562 (upper number) or Jurkat (lower number) are indicated. The dots are colored based on the density of dots relative to their coordinates. The associated boxplots show the distribution of enhancer-promoter contacts relative to local background in both cell types, relative to the median ratio in Jurkat. (*** Two-sided Wilcoxon signed-rank test p-value < 1X10−100). (E) Boxplot shows the relative increase of enhancer-promoter contacts associated with promoters of genes with upregulated gene body transcription in K562 and with a corresponding significant increase in pausing signal (pause change – PC, n=167) or without a change in pausing signal (no pause change – NPC, n=173) (*** Two-sided Mann-Whitney p-value < 1X10−100). For all boxplots, boxes show the median, and 25–75 inter quartile range (IQR) and the maximum length of the whiskers is 1.5 IQR.