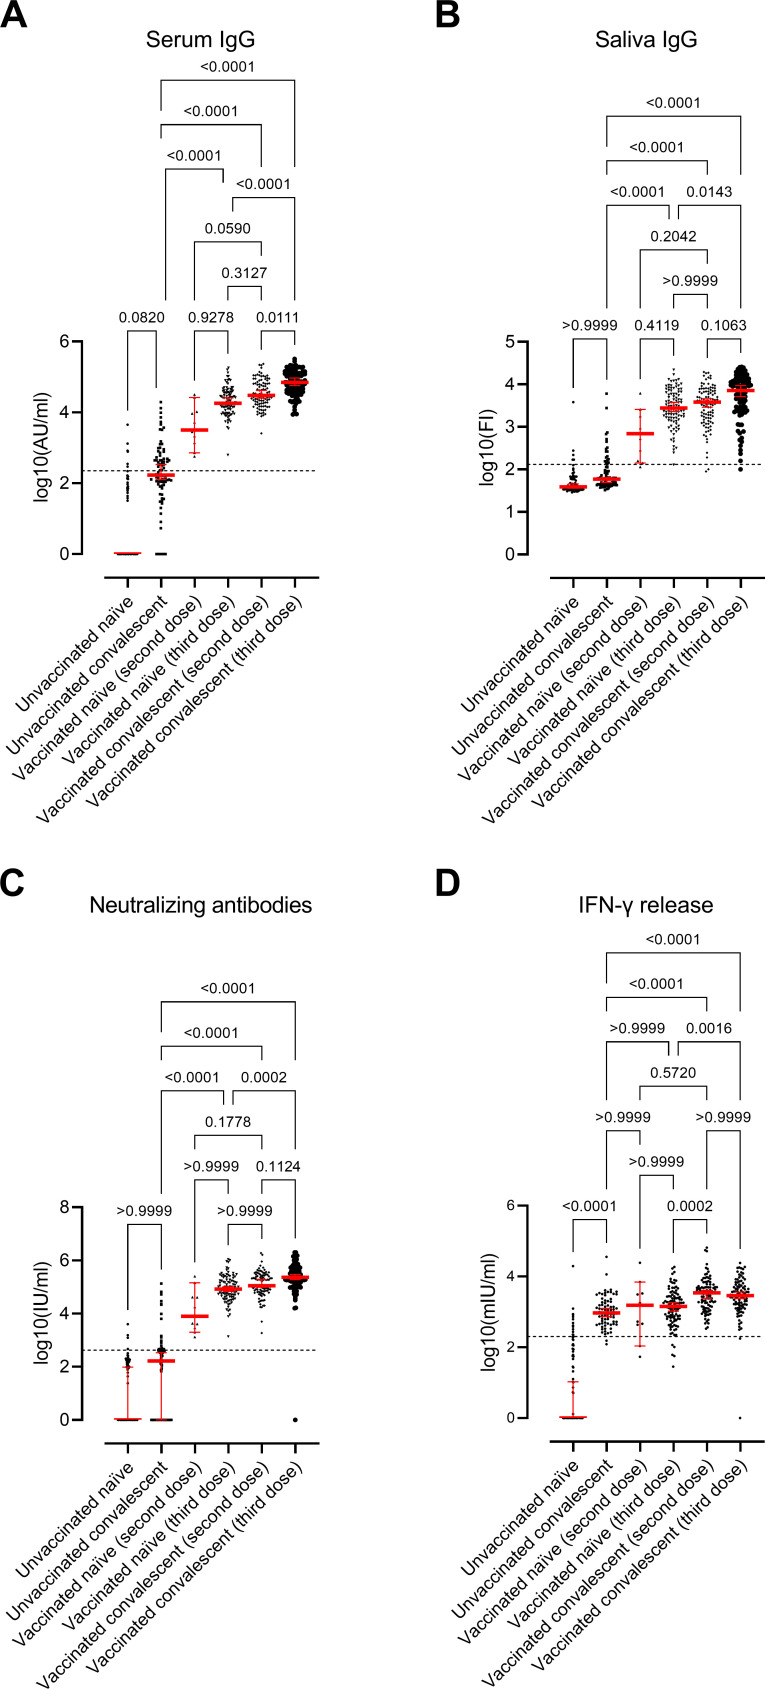
Fig 2.
Immune response in study groups. Scatter plots display the median values and 95% CI (red line and bars): Serum RBD-IgG antibodies (A), saliva RBD-IgG antibodies (B), NAbs (C), and IFN-γ release after stimulating - cells against spike protein (D). The participants are divided into six groups based on SARS‐CoV‐2 infection and/or vaccination: (i) unvaccinated SARS-CoV-2-naïve individuals (n = 88); (ii) unvaccinated SARS-CoV-2 convalescent individuals (n = 82); (iii) vaccinated SARS-CoV-2-naïve individuals (second dose; n = 11); (iv) vaccinated SARS-CoV-2-naïve individuals (third dose; n = 103); (v) vaccinated convalescent individuals (second dose; n = 102); and (vi) vaccinated convalescent individuals (third dose; n = 107). The horizontal line represents the threshold for assay positivity (225 AU/mL for IgG, 132 FI for saliva IgG, 420 IU/mL for NAbs, and 200 mIU/mL for IFN-γ). P < 0.05 was considered statistically significant. Experimental analyses were performed using Wildtype-RBD.

