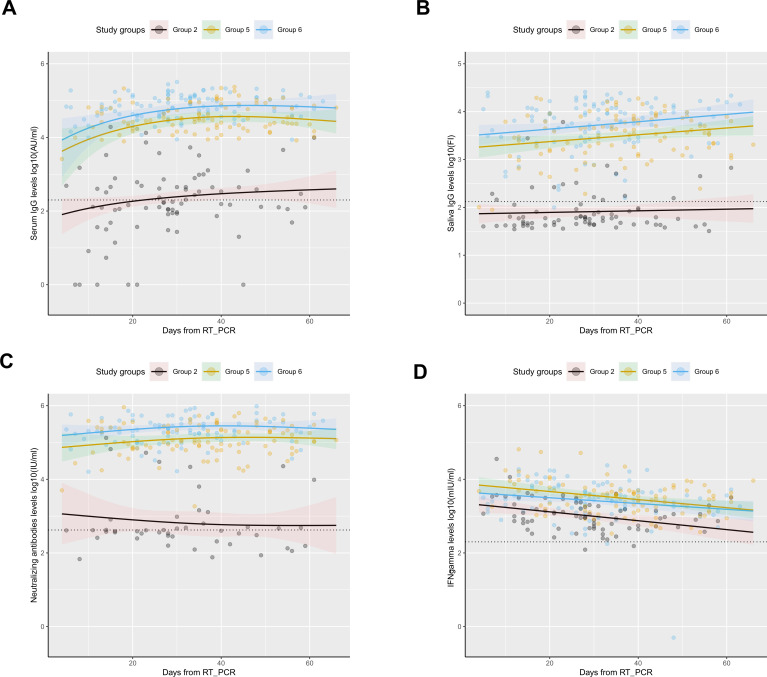
Fig 3.
Antibody levels and IFN-γ levels dynamics over time in convalescent individuals using mixed models. Distribution of (A) serum IgG levels, represented in log10(AU/mL), (B) saliva IgG levels, represented in log10(FI), (C) NAbs levels, represented in log10(IU/mL); and (D) IFN-γ levels, represented in log10(mIU/mL) over time (days from positive RT-PCR result). Circles represent observed levels for (A) serum IgG, (B) saliva IgG, (C) NAbs, and (D) IFN-γ. Solid lines represent predicted levels for (A) serum IgG levels, (B) saliva IgG levels, (C) NAbs levels, and (D) IFN-γ levels. Black, yellow, and blue colors represent unvaccinated convalescent individuals (group 2), vaccinated convalescent individuals (second dose; group 5), and vaccinated convalescent individuals (third dose; group 6), respectively. The horizontal dotted line represents the assay positivity threshold. The confidence interval (95%) is represented by the shadowed areas. The center for the confidence interval is the predicted (mean) values.

