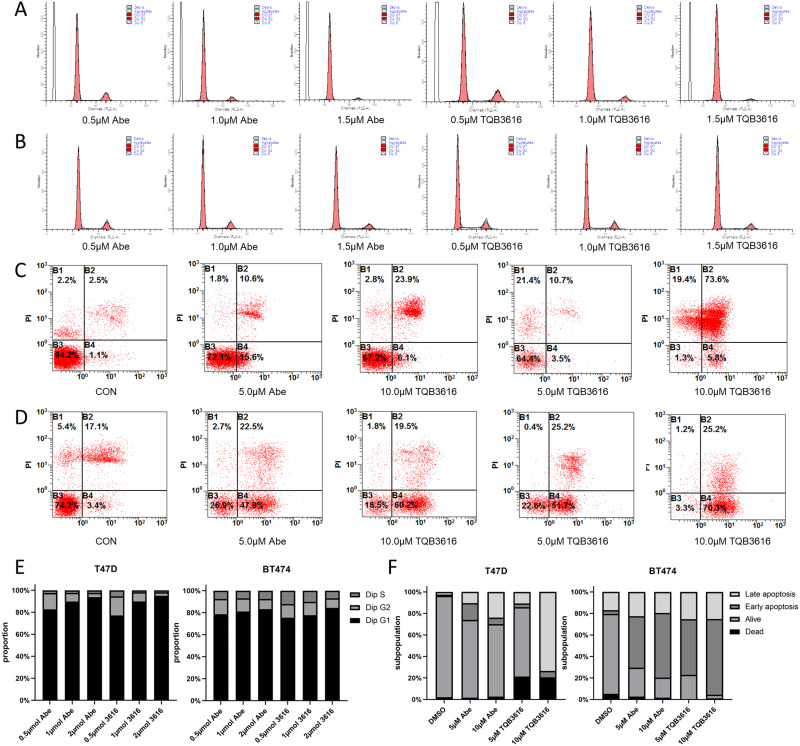
Figure 4.
Abemaciclib and TQB3616 effects on the apoptosis rate and cell cycle progression. (A and B) After 24 hours of incubation with PBS (CON), abemaciclib (0.5 μM, 1.0 μM, or 1.5 μM), or TQB3616 (0.5 μM, 1.0 μM, or 1.5 μM) treatment, PI staining and flow cytometry were used to determine the proportion of T47D and BT474 cells in each phase of the cell cycle. The cell cycle analysis was performed with ModFit. (C and D) By double staining cells with annexin V-FITC/PI and analyzing the flow cytometry results, apoptotic T47D and BT474 cells were identified. TQB3616 (0.5 μM, 1.0 μM, or 1.5 μM) was incubated with cells for 24 hours. (E) Histograms show representative results. TQB3616 and abemaciclib induced clear G1/S phase arrest, in contrast to that observed for the control group. (F) Histograms show representative results. Apoptosis was and cellular stress was induced in HR-positive breast cancer cell lines by TQB3616 or abemaciclib, in contrast to the control cells. The means and standard deviations were calculated on the basis of three independent experiments.

