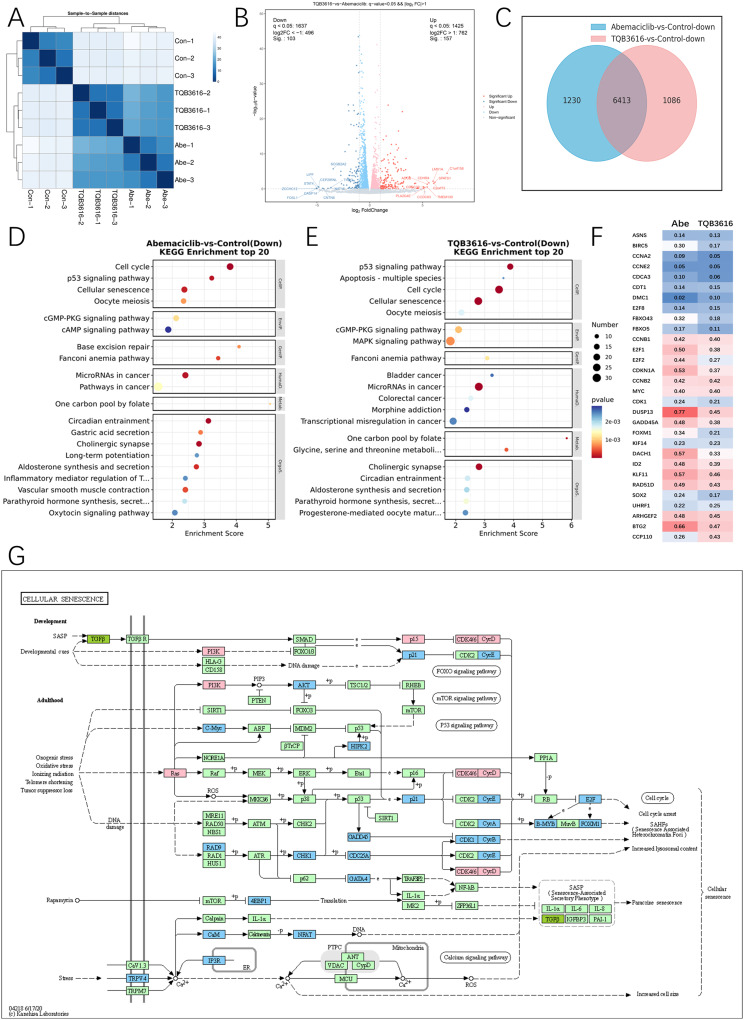
Figure 6.
Inhibition of breast cancer cell growth by TQB3616 may have been enhanced by increased apoptosis. (A) The colors in the cluster map showing the sequenced samples indicate the gene expression levels as indicated by the correlation coefficients. (B) A volcano plot showing gene expression with red lines representing upregulated genes and blue lines representing downregulated genes. (C) Intersection of common downregulated genes in the abemaciclib or TQB3616 groups compared with the blank control group. (D) WikiPathways enrichment analysis of top 20 Down in abemaciclib group compared with blank control group (Pathway entries correspond to more than 2 differentially expressed genes). E WikiPathways enrichment analysis of top 20 Down in TQB3616 group compared with blank control group (Pathway entries correspond to more than 2 differentially expressed genes). (D–E) WikiPathways enrichment analysis top 20 (Pathway entries corresponding to more than 2 differentially expressed genes). (F) Subset of genes commonly altered by CDK4/6-targeted therapy in MCF-7 breast cancer cell line xenograft studies. Values represent the mean percentage of gene expression inhibition in the abemaciclib and TQB3616 groups compared to the vehicle control group. (G) TQB3616-induced DEG enrichment in KEGG pathways in T47D cells compared to control cells.

