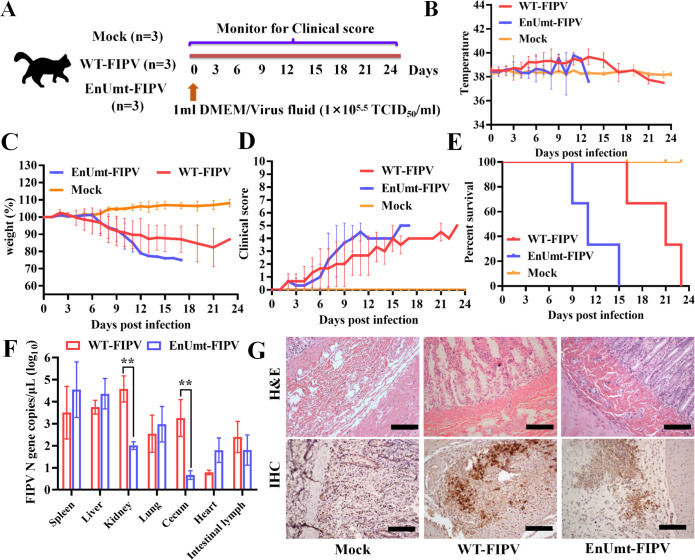
Fig 6.
Evaluating the clinical presentation and mortality of WT- and EnUmt- FIPV in cats. (A) Schematic diagram of the animal experiment. A total of nine cats were randomly grouped into three groups. These cats were either mock or infected with WT- and EnUmt-FIPV. (B) Response of cat body temperatures to WT- and EnUmt-FIPV infection over time. (C) Results of weight monitoring after WT- and EnUmt-FIPV infection. On day 0 before infection, the body weight was 100%. (D) The clinical status scores of the cats (1 point was assigned in any of the following cases) were as follows: 1, cats that had a fever (>39°C); 2, cats that were anorexic; 3, cats that were lethargic; 4, cats that had weight loss (>5%); and 5, cats that were unable to stand, had severe dyspnea, or were moribund. (E) Percent survival of the cats in the different infection groups. (F) Statistical analysis of FIPV antigen distribution in different tissues of cats. RNA was isolated from different tissue (spleen, liver, kidney, lung, cecum, heart, and intestinal lymph) samples and subjected to quantitative PCR to determine the number of genomic RNA copies per microliter of sample. Values were analyzed with unpaired t-tests used for comparisons between the groups, **P < 0.01. (G) Histology and immunohistochemical staining of uninfected mock, WT-FIPV-infected and EnUmt-FIPV-infected cat cecum. Images show representative histological slides of ileum specimens showing H&E staining and IHC staining using rabbit anti-FIPV N protein antibody. Scale bar, 200 µm. The representative data sets (B–F) of three independent experiments are shown.

