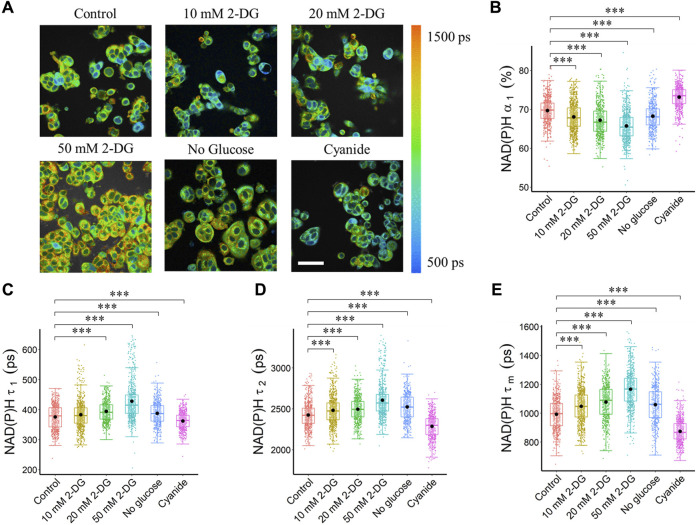
FIGURE 1.
Glycolysis and OXPHOS inhibition alter the NAD(P)H fluorescence lifetimes of MCF7 cells. Glycolysis inhibition increased NAD(P)H fluorescence lifetime (τ 1 , τ 2 , τ m ), and reduced free NAD(P)H fraction (α 1 ), while OXPHOS inhibition reduced NAD(P)H fluorescence lifetime (τ 1 , τ 2 , τ m ), and increased free NAD(P)H fraction (α 1 ). (A) Representative NAD(P)H τ m images, scale bar = 60 μm. (B) NAD(P)H α 1 (C) NAD(P)H τ 1 (D) NAD(P)H τ 2 and (E) NAD(P)H τ m . ***p < 0.001 for two-sided Wilcoxon test with Bonferroni correction for multiple comparisons. Substrates in each media: Control (25 mM glucose +1 mM pyruvate), 2-DG (25 mM glucose +1 mM pyruvate +10/20/50 mM 2-DG), No glucose (50 mM pyruvate), Cyanide (25 mM glucose +1 mM pyruvate +4 mM NaCN).

