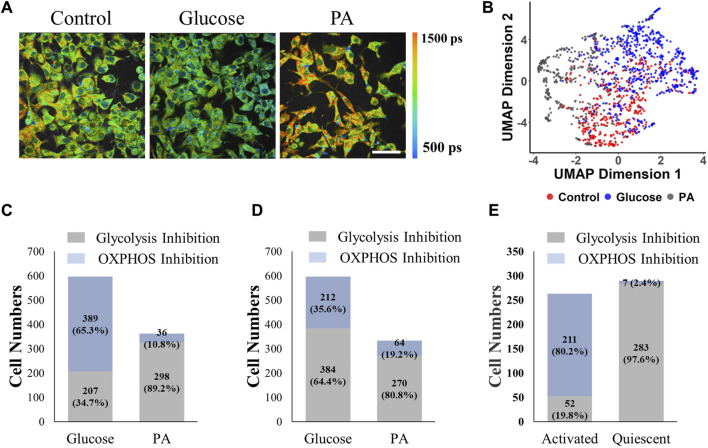
FIGURE 6.
MCF7 cell-trained model prediction performance for liver cancer cells and T cells. The RFT machine learning model trained with normalized MCF7 cell data effectively predicted glycolysis or OXPHOS use in hepatocellular cells, and T cells. (A) Representative NAD(P)H τ m images of HepG2 cells exposed to control media (starved condition), glucose (30 mM), and palmitate (0.4 mM PA), scale bar = 60 μm (B) UMAP data reduction technique allows visual representation of the separation between different metabolic groups of hepatocellular cells. Each color represents a metabolic group, red corresponds to control, grey and blue to glucose treated, and PA treated respectively. (C) Prediction of HepG2 cell metabolism by the RFT model trained with MCF7 cells. (D) Prediction of HepG2 cell metabolism by the CNN model trained with MCF7 cells. (E) Prediction of activated and quiescent T cell metabolism by the RFT model trained with MCF7 cells.

