Figure 7.
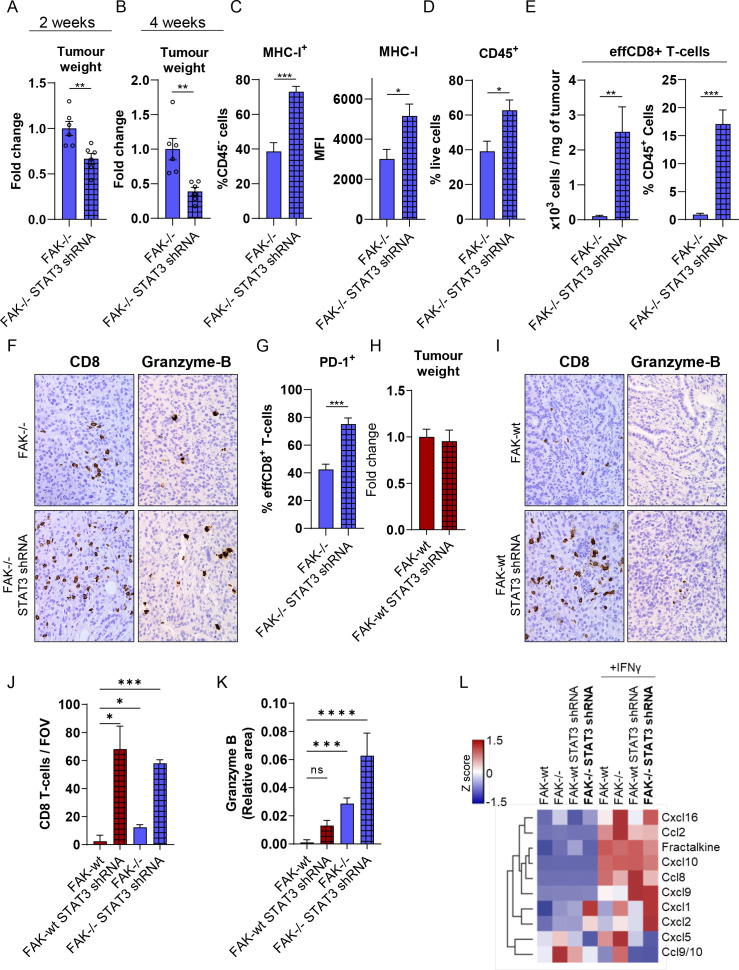
Co-depletion of FAK and STAT3 potentiates antitumour immunity. (A) Fold change in tumour weight relative to FAK-/- tumours 2 weeks postimplantation into the pancreas of C57BL/6 mice. n=6 tumours per group. (B) Fold-change in tumour weight relative to FAK-/- tumours 4 weeks postimplantation into the pancreas of C57BL/6 mice. n=6 tumours per group. (C) Left, flow cytometry quantification of MHC-I-expressing cells as a percentage of CD45- cells from FAK-/- and FAK-/-STAT3shRNA tumours. Right, flow cytometry quantification of the median fluorescence intensity of MHC-I expression in CD45- cells from FAK-/- and FAK-/-STAT3shRNA tumours. n=5 tumours per group. (D) Flow cytometry quantification of CD45+ cells as a percentage of live cells from FAK-/- and FAK-/-STAT3shRNA tumours. n=5 tumours per group. (E) Flow cytometry quantification of effCD8+ T-cells represented as number of cells per mg of tumour tissue (left) and as a percentage of CD45+ cells (right) from FAK-/- and FAK-/-STAT3shRNA tumours. n=5 tumours per group. (F) Representative images of FAK-/- and FAK-/- STAT3shRNA tumour sections stained with anti-CD8 or anti-granzyme-B antibodies. (G) Flow cytometry quantification of PD-1+ cells as a percentage of effCD8+ T-cells from FAK-/- and FAK-/-STAT3shRNA tumours. n=5 tumours per group. (H) Fold change in tumour weight relative to FAK-wt tumours 2 weeks postimplantation into the pancreas of C57BL/6 mice. n=6 tumours per group. (I) Representative images of FAK-wt and FAK-wt STAT3shRNA tumour sections stained with anti-CD8 or anti-granzyme-B antibodies. (J) Quantification of the number of CD8 T-cells per field of view (FOV) from F and I. (K) Quantification of the relative area positive for Granzyme B staining per FOV from (F, I). (L) Proteome profiler array analysis of chemokine secretion from FAK-wt, FAK-/-, FAK-wt STAT3shRNA and FAK-/- STAT3shRNA cells±10 ng/mL IFNγ stimulation for 24 hours. Data in (A–E, G, H, J, K) represented as mean±SEM. Statistical significance in (A–E, G and H) calculated using a two-tailed unpaired t-test. Statistical significance in J and K calculated using a Kruskal-Wallis test with Dunn’s multiple comparison. *p≤0.05, **p≤0.01, ***p≤0.001, ****p≤0.0001. FAK, focal adhesion kinase; MHC-I, Major Histocompatibility Complex class-I.

