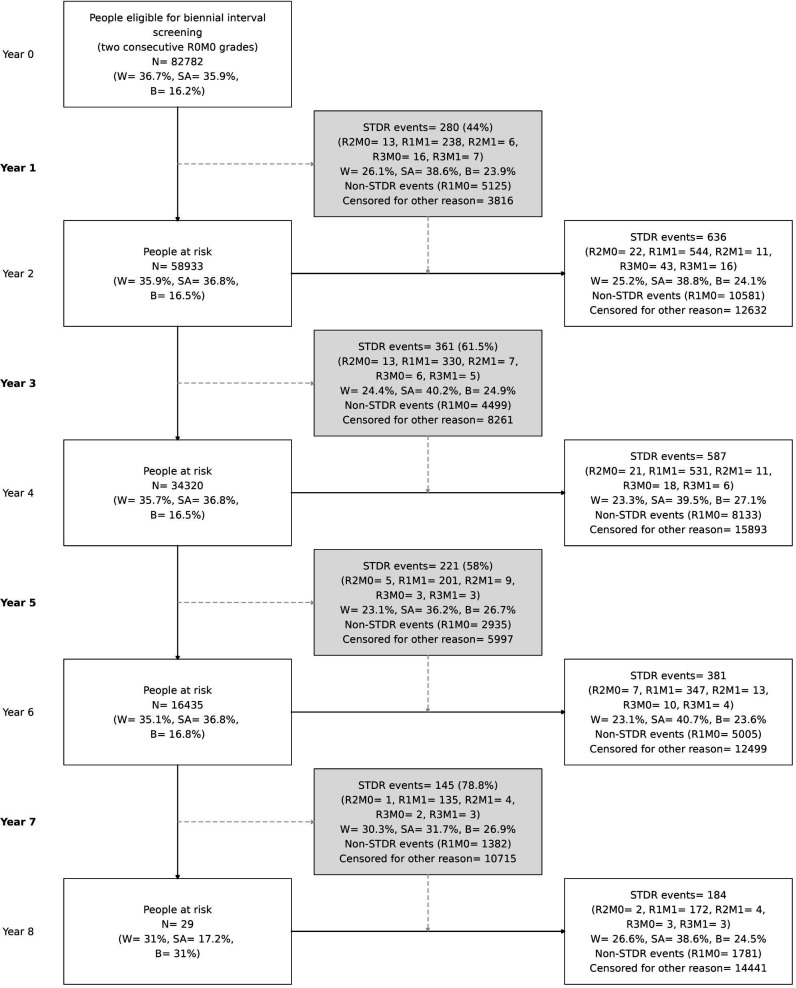
Figure 2.
Model of biennial screening in the NELDESP cohort. Grey boxes in column 2 show the number of STDR and PDR events that would have been diagnosed and referred in routine annual screening during the biennial interval but diagnosed at least one year later in two-yearly interval screening. A breakdown by 3 major ethnic groups is presented in each box. Percentages in grey boxes relative to the total STDR and PDR (R3) events from a 2-year interval. W: white, SA: South Asian, B: black. B, black; SA, South Asian; STDR, sight-threatening diabetic retinopathy; W, white.

