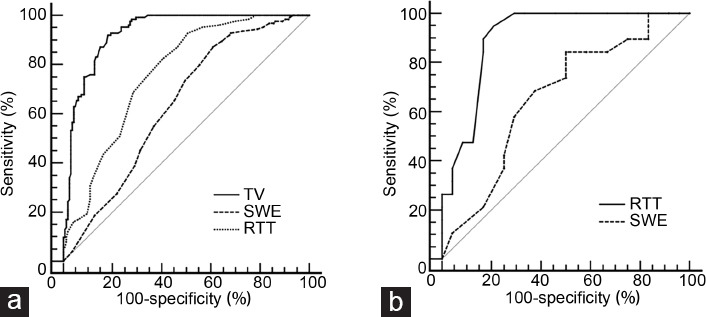
Figure 4.

ROC curve. (a) ROC curve evaluating the diagnostic performance of TV, RTT, and SWE. The AUCs of TV, RTT, and SWE were 0.932 (95% CI: 0.904–0.960), 0.765 (95% CI: 0.711–0.818), and 0.637 (95% CI: 0.574–0.700), respectively. (b) ROC curve evaluating the diagnostic performance of RTT and SWE in the TV range of 9–11 cm3. The AUCs of RTT and SWE were 0.904 (95% CI: 0.811–0.996) and 0.662 (95% CI: 0.502–0.799), respectively. ROC: receiver operating characteristic; TV: testicular volume; RTT: rete testis thickness; SWE: shear wave elastography; AUC: area under the curve; CI: confidence interval.
