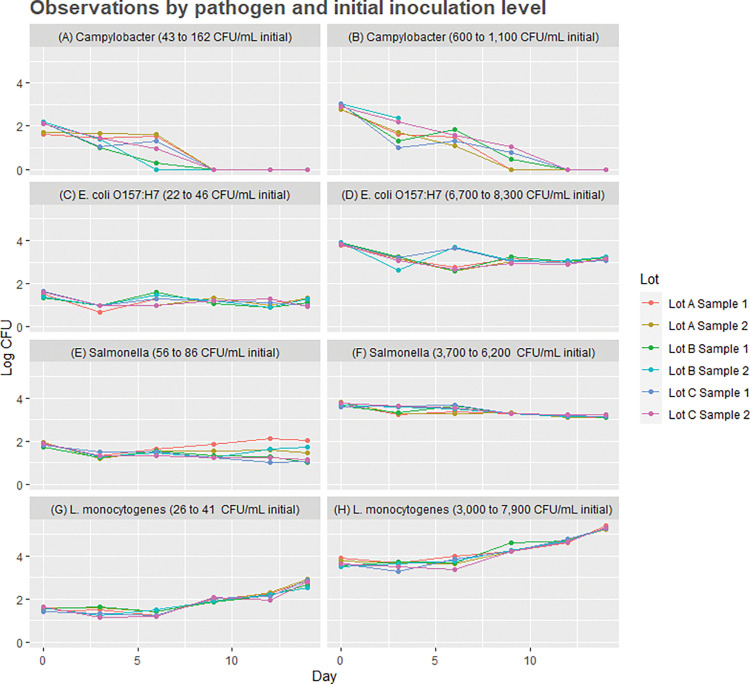
Fig 1. Plots of the 48 time-series observations by pathogen, initial inoculation levels (labels for each of 8 plots in log10 CFU/mL), and raw milk lots over 14 days of incubation at 4.4°C.
Pathogen counts are reported on the vertical axis in log10 CFU/mL, with time in days post-inoculation on the horizontal axis. Note that 600 CFU/mL in the figure label is equivalent to 2.8 log10 CFU/mL on the vertical axis.

