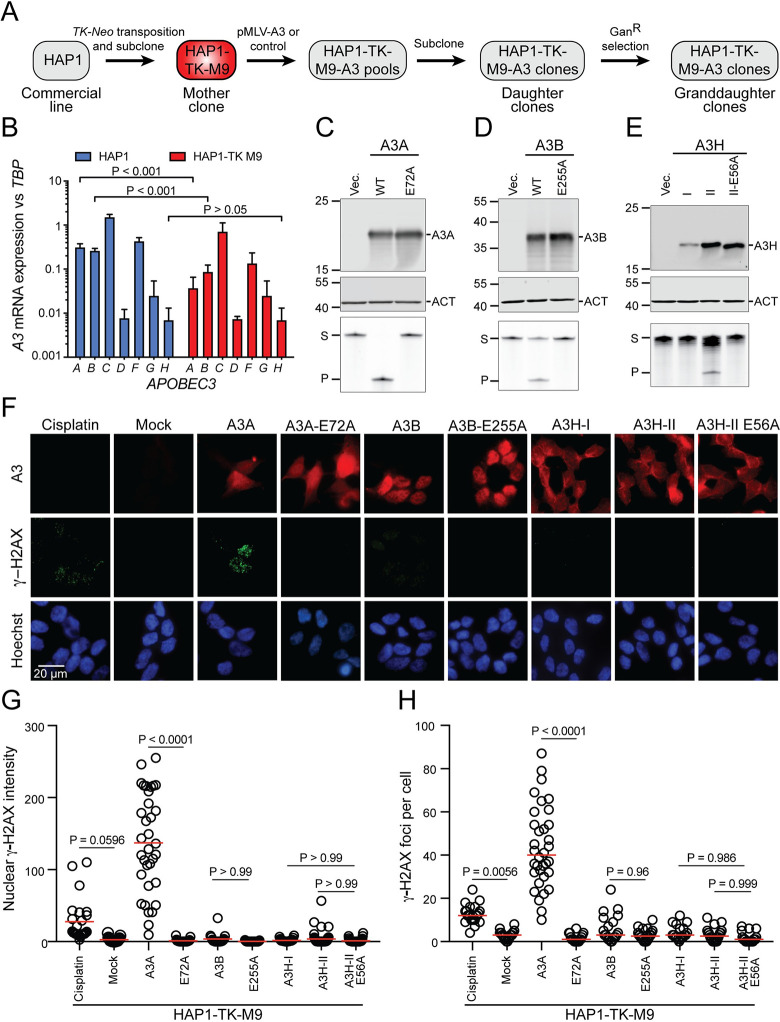
Fig 1. A3 activity in the HAP1-TK-M9 mutation reporter system.
(A) Schematic of the construction of the HAP1-TK-M9 system and overall experimental workflow (see S1 Fig for HAP1-TK-M9 karyotype). (B) A3 mRNA levels in parental HAP1 cells in comparison to the HAP1-TK-M9 daughter clone by RT-qPCR (p-values from Welch’s t-test). (C-E) Immunoblots of A3A, A3B, and A3H in WCE 24 hrs post-transfection of 293T cells. Primary antibodies are UMN-13, 5210-87-13, and P1-D8, respectively. Mouse anti-β-actin (ACT) is a loading control for the A3A and A3B blots, and rabbit anti-β-actin (ACT) for the A3H blot (see S2 Fig for anti-A3A UMN-13 mAb validation). The lower images show ssDNA deaminase activity of extracts from the same cell populations (S, substrate; P, product). (F) IF microscopy images of HAP1-TK-M9 cells expressing the indicated A3 enzymes or treated with 4 μM cisplatin for 24 hrs. A3 staining is red, γ-H2AX staining is green, and nuclei are blue from Hoechst (scale bar = 20 μm). (G-H) Quantification of pan-nuclear γ-H2AX intensity and discrete γ-H2AX foci, respectively, for each condition described in panel F (each data point represents an independent cell; n>25 cells per condition; p-values from one-way ANOVA test; red bar indicates mean for each group; representative of 2 biologically independent experiments).

