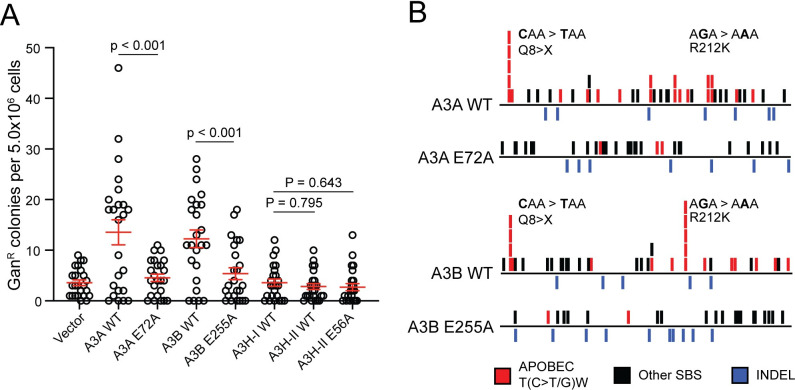
Fig 2. Characterization of TK mutations in ganciclovir-resistant clones.
(A) A dot plot of GanR colonies generated under the indicated A3 expression or control conditions. Each data point represents the number of GanR mutants in a single clonal culture (mean +/- SD shown with p-values determined using Welch’s t-test). (B) Schematics representing all TK mutations observed under the indicated A3 expression conditions (APOBEC3 signature T(C>T/G)W mutations in red, other SBSs in black, and INDELs in blue; see S5 Fig for schematics of individual TK mutants for these and vector control conditions). Q8X and R212K mutation hotspots are labeled.

