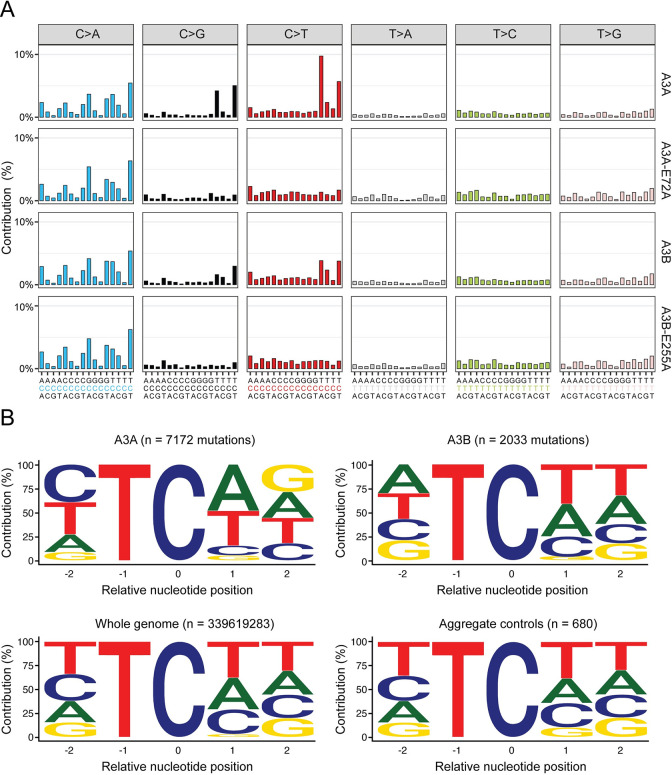
Fig 3. Single base substitution mutation signatures in granddaughter clone genomes.
(A) Trinucleotide profiles of pooled SBSs across all clones sequenced for each listed experimental condition (A3A n = 6; A3A-E72A n = 2; A3B n = 5; A3B-E255A n = 2). See S6 and S7 Figs for mRNA and protein level expression confirmation, respectively, and S10 Fig for SBS profiles from each WGS. (B) Pentanucleotide logos depicting -2, +1 and +2 sequence preferences flanking all C-to-T and C-to-G mutated TC motifs in WGS from HAP1-TK-M9 cells expressing A3A or A3B in comparison to aggregate controls (catalytic mutants and eGFP only conditions, which do not show evidence for APOBEC3 signature mutations; S10 Fig). The distribution of nucleobases flanking all TC motifs in the human genome is shown for comparison.

