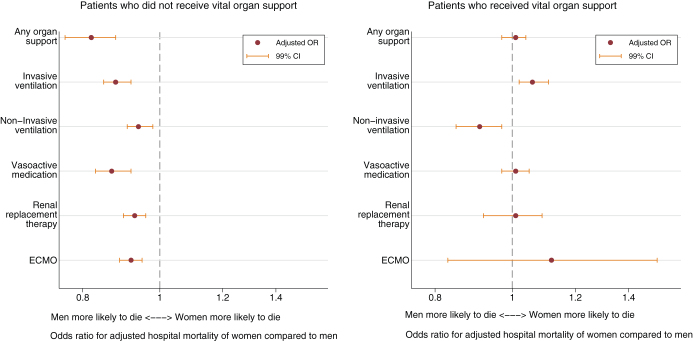
Figure 3.
Adjusted hospital mortality of women compared with men, stratified by vital organ support provided. The x-axis plots the adjusted hospital mortality of women compared with men, adjusted for Acute Physiology and Chronic Health Evaluation III score, admission diagnosis, limitation of medical treatment, admission year, and hospital site. The total study population is stratified according to the provision of each organ support: the left-hand graph plots mortality of patients who did not receive the organ support and the right-hand graph plots mortality patients who received the organ support. ECMO = extracorporeal membrane oxygenation, OR = odds ratio.

