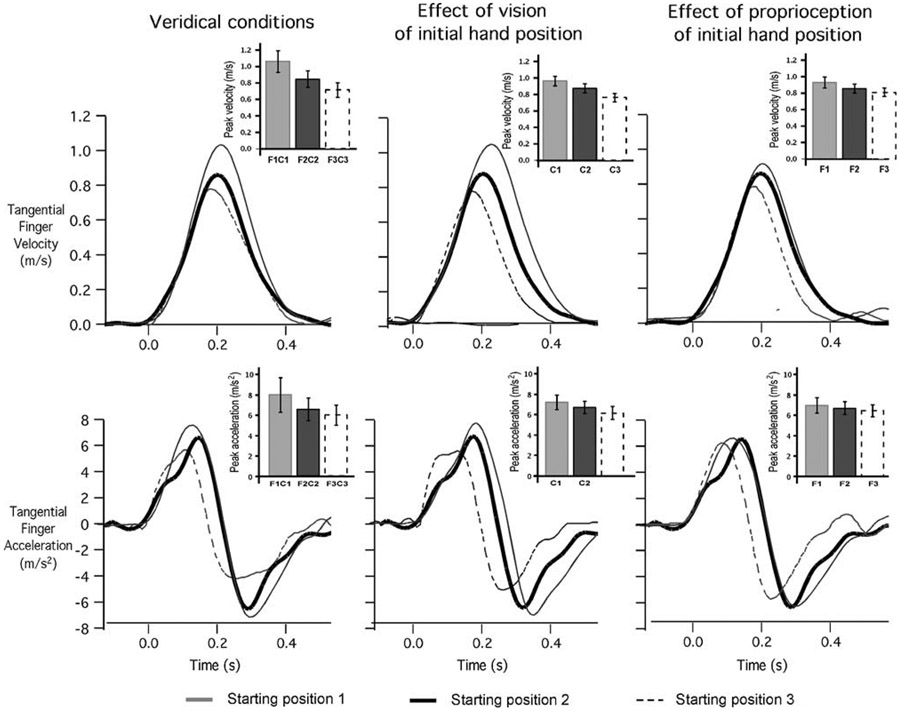
Fig. 3.
Representative velocity (top) and acceleration (bottom) profiles of reaching movements toward a visual target under the experimental conditions. Profiles are synchronized to movement onset for sake of clarity. Insets represent averaged peak velocity and peak acceleration as a function of condition. Error bars represent between subject standard errors

