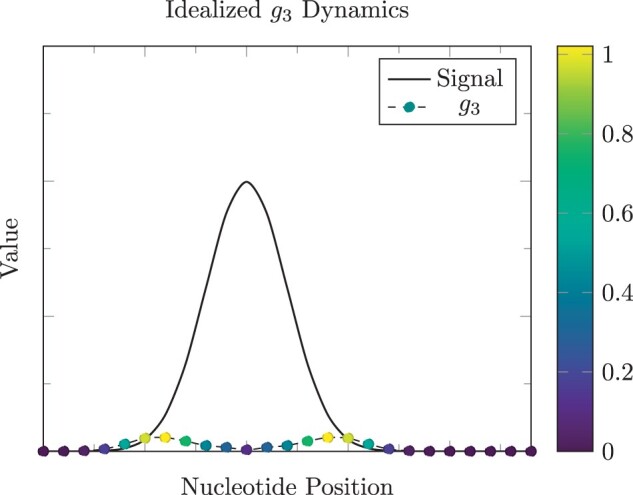
Figure 2.

The g3 term in Equation (2) is designed to more accurately determine peak edges to capture enriched regions in their whole. This function is greatest (yellow marks) near the ends of the enriched region and lowest (dark blue marks) at peak centers in this idealized example.
