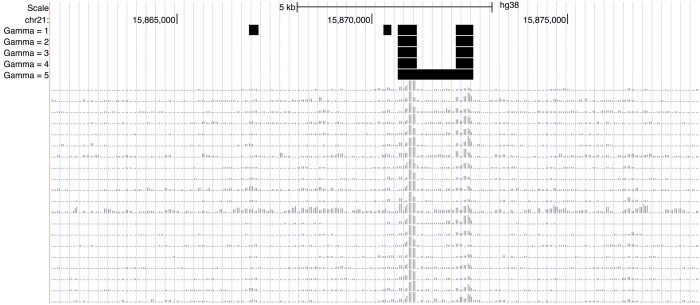
Figure 3.
Example behavior of ROCCO in the UCSC Genome Browser (Karolchik et al. 2003) as γ is increased. The black bars in each track correspond to ROCCO’s predictions given the samples’ enrichment signals below. In the last row, we see that two distinct regions of enrichment are merged due to the strong influence of adjacent loci imposed by the γ = 5 parameter.

