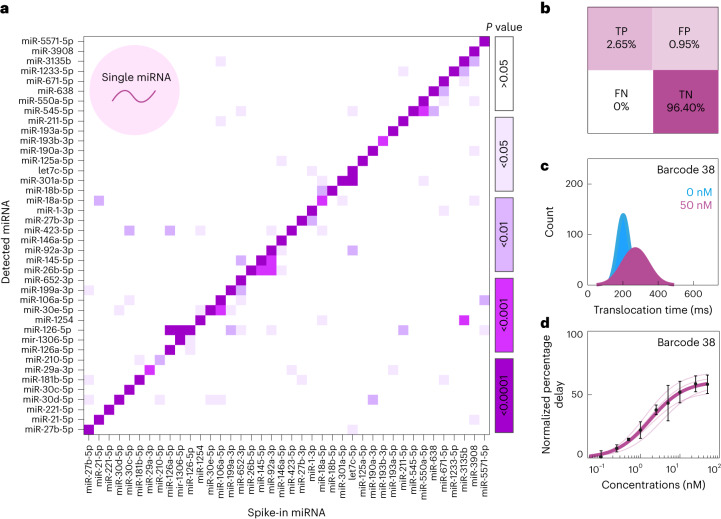
Fig. 3. Sensitivity and selectivity of single miRNA detection.
a, Heat map showing significance for selective miRNA binding. The 40 barcoded probes (30 nM) were incubated with each miRNA (10 nM), respectively. A significant increase (two-tailed t-test, **P ≤ 0.01) in percentage delayed events was observed for all barcoded probes when in the presence of their miRNA target (n = 3, ntotal events = 712,400). b, Confusion matrix showing true positive (TP), false positive (FP), false negative (FN) and true negative (TN) occurrence. The accuracy was 99.05%, specificity was 99.02% and sensitivity was 100%. c, Translocation time of single barcoded probe and single miRNA experiments (n = 5, ntotal events = 54,197). d, Concentration–percentage delay relationship of single miRNA and single barcoded probe experiment (barcoded probe 38, miR-221-5p). Data were fitted using the Hill equation with nH = 1 (dissociation constant (Kd)= 1.77 nM and Vmax = 61.03%, R2 = 96.25, n = 5, ntotal events = 54,197). Data presented as mean ± s.d. All experiments were performed in sequencing buffer.

