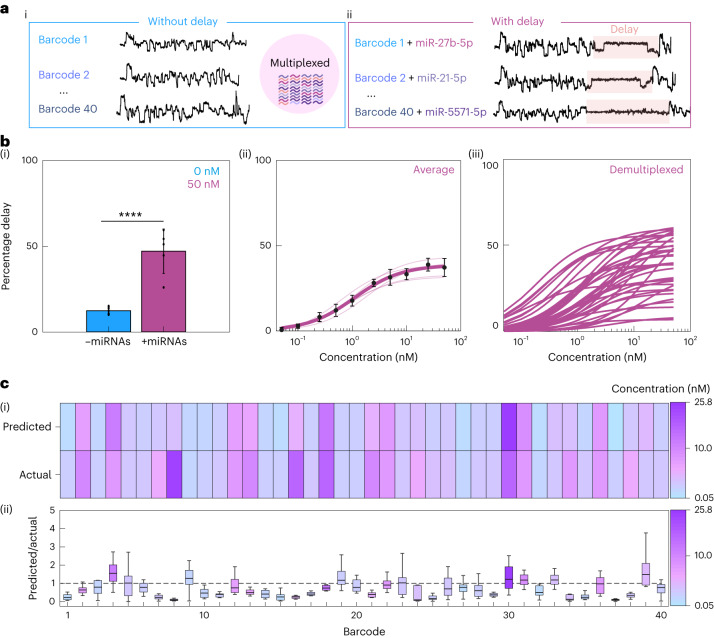
Fig. 4. Multiplexed detection and quantification of miRNAs.
a, Example current traces for barcodes without delay (i) and with delay (ii). b, Mean percentage delay ±50 nM miRNAs (two-tailed t-test, ****P = 3.58 × 10⁻⁴, n = 5, ntotal events = 76,841 (0 nM), 69,983 (50 nM)). Data presented as mean ± s.d. (i). Multiplexed concentration–percentage delay curves of 40 barcoded probes (30 nM) and the corresponding 40 miRNAs. A curve was fitted using the Hill equation with nH = 1 (Kd = 1.09 nM, Vmax = 38.69%, n = 5, ntotal events = 1,045,841). Data presented as mean ± s.d. (ii). Concentration–percentage delay curves of 40 individual barcoded probes derived from a multiplexed experiment. Curves were fitted with the Hill fit (nH = 1) background subtraction for each curve was performed using the percentage delay value at 0 nM for each curve (n = 5, ntotal events = 1,045,841) (iii). c, Single-blinded prediction of miRNA concentration and comparison to known concentration. Heat map of concentrations (n = 12, ntotal events = 203,812) (i). Analysis of miRNA predictions showing the value for predicted/actual concentration (n = 12, ntotal events = 203,812) (ii). Summary statistics for box plot: centre, median; bounds of box, IQR 25th and 75th percentile; whiskers, minimum and maximum within 1.5 IQR. All experiments were performed in sequencing buffer.

