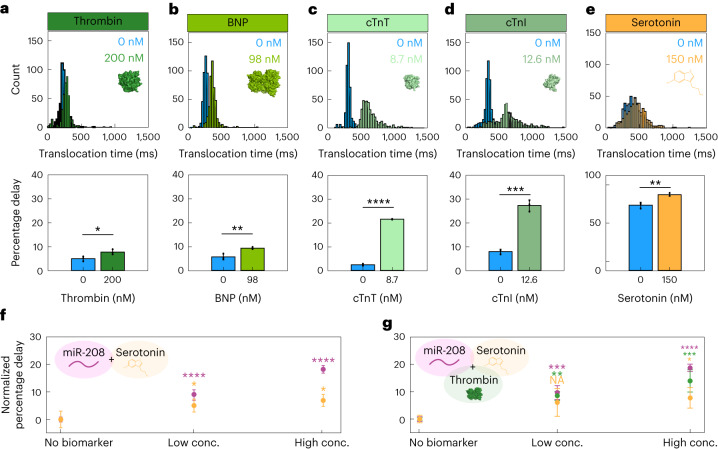
Fig. 5. Protein and small molecule detection.
a–e, Translocation time (top) and percentage delayed events (bottom) of barcoded probes (30 nM) ± each corresponding protein or small molecule: thrombin (n = 3, ntotal events = 417 (0 nM), 1,341 (200 nM); *P = 0.0303) (a); BNP (n = 3, ntotal events = 5,256 (0 nM), 1,040 (98 nM); **P = 0.0082) (b); cTnT (n = 3, ntotal events = 8,920 (0 nM), 3,395 (8.7 nM); ****P = 1.62 × 10⁻⁷) (c); cTnI (n = 3, ntotal events = 1,024 (0 nM), 1,024 (12.6 nM)); ***P = 1.99 × 10⁻⁴) (d); serotonin (n = 3, ntotal events = 2,329 (0 nM), 1,602 (150 nM)); **P = 0.005) (e). Significance was determined by two-tailed t-tests. f, Multiplexed detection of serotonin and miR-208-5p. Low concentrations (conc.) (10 nM miR-208-5p, 150 nM serotonin) and high concentrations (50 nM miR-208-5p, 750 nM serotonin) were compared to the normalized control (no biomarker present) (ANOVA, F (2,9) = [96.04], ****P = 8.49 × 10⁻⁷, F (2,9) = [6.36], *P = 1.90 × 10⁻², n = 3, ntotal events = 65,545). g, Multiplexed detection of miR-208-5p, serotonin and thrombin. Low concentrations (10 nM miR-208-5p, 150 nM serotonin, 300 nM thrombin) and high concentration (50 nM miR-208-5p, 750 nM serotonin, 1,500 nM thrombin) were compared to the normalized control (no biomarker present). Normalized percentage delay of barcoded probes is shown (ANOVA, F (2,8) = [136.97], ****P = 6.48 × 10−71, F (2,8) = [4.74], *P = 4.38 × 10⁻², F (2,8) = [28.57], ***P = 2.00 × 10⁻⁴, n = 3, ntotal events = 44,956). All data are presented as mean ± s.d. All experiments were performed in sequencing buffer. NA, not applicable.

