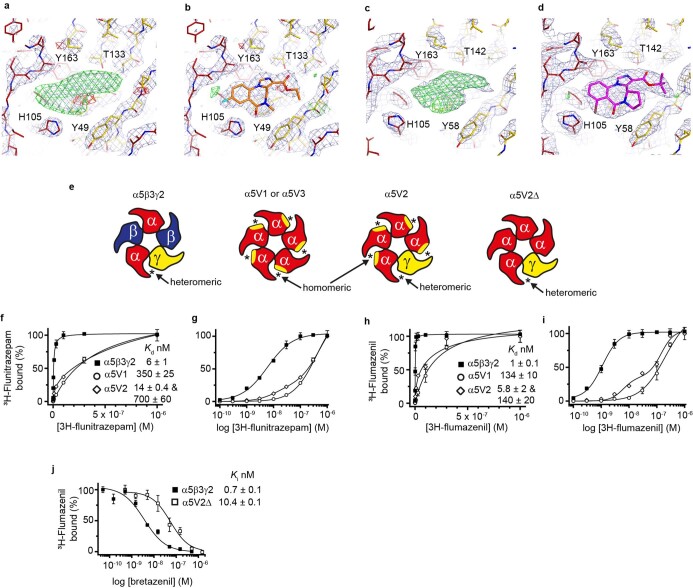
Extended Data Fig. 2. BZD binding data for α5V1, α5V2, α5V3.
a, Omit electron density contoured at 3σ (blue/purple mesh), and Polder omit electron density contoured at 4σ (green and red mesh), associated with flumazenil in α5V1 between chains B:C. b, 2Fo-Fc map contoured at 1.6σ. c, and d, equivalent bretazenil maps for α5V2 at the heteromeric site, chains B:C. e, Schematic top-down rosettes of the subunit make-up of α5β3γ2, α5V1 or α5V3, α5V2, α5V2Δ. The homomer site is created between residues from the α5 principal face (red) and substituted γ2 residues from the complementary face (yellow). In α5V2Δ the γ2 substituted complementary face has not been created in the α5 subunits, leaving only a single heteromeric binding site between the α5 and γ2 domains – this construct was made to measure the affinity of the single heteromeric site in isolation. * indicates site is occupied by drug in structure. f, Saturation binding experiment with 3H-flunitrazepam. g, corresponding log plot to visually distinguish the two different affinity sites of α5V2. h, and i, Equivalent 3H-flumazenil experiment and log plot. j, Bretazenil binding competition experiment against 3H-flumazenil. Calculated inhibition constant (Ki) values are based on Kd values in h. Values are mean ± S.E.M. for n ≥ 3 separate experiments.

