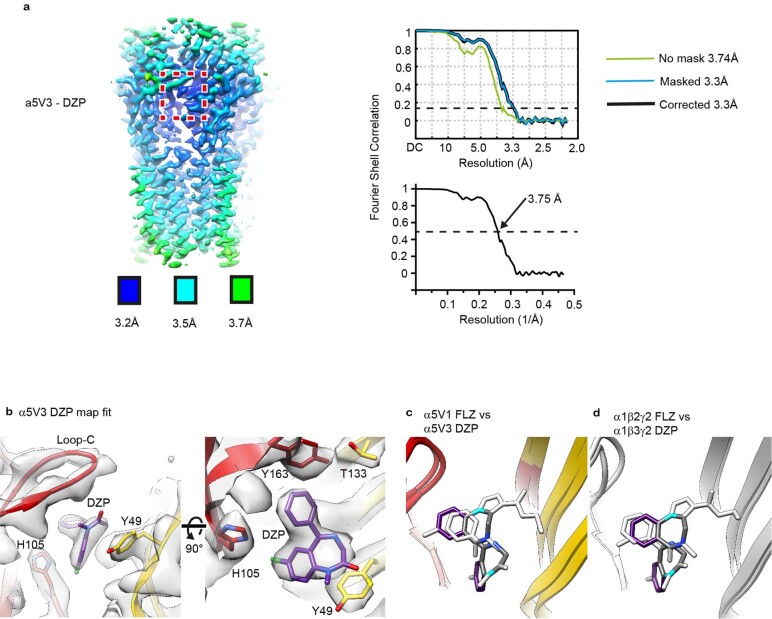
Extended Data Fig. 3. Local resolution map, overall plotted resolutions, global map-model agreements, and diazepam binding mode.
a, For the structure, α5V3-DZP, a map on the left is coloured by local resolution (see Methods). Maps of Fourier shell correlation (FSC) (upper right panel) and map-model FSC (lower right panel) plots are also shown. b, Cryo-EM map and corresponding structural model of α5V3 bound to diazepam confirming ligand fit and orientation. The isosurface level of the protein and ligand are the same. Shown from two viewing angles. c, Overlay of binding site of α5V1 bound by flumazenil and α5V3 bound to diazepam. The ligands are white except for the phenyl ring in purple, and the diazepine ring in grey with nitrogens in cyan or blue, to emphasise the alternative “flipped” orientation of the benzodiazepine component between the Type I BZD diazepam and Type II BZD flumazenil. d, Equivalent image comparing α1β2γ2 bound by flumazenil (PDB 6X3U) and α1β3γ2 bound by diazepam (PDB 6HUP). For reference, equivalent complementary face residue numbering of α5V3 Y49, A70, T133, in wild type γ2 is Y58, A79, T142 respectively. Loop-C, which binds over the pocket, like a cap, is not shown for clarity.

